
 4 hours ago
18
4 hours ago
18

Neutral situation for the ServiceNow stock: NOW closed at 102.12, above the short-term moving average but still far from the EMA200. Stable volatility and price are in the upper third of the Bollinger Bands, which keeps short-term pressure in place, but the overall fundamental picture still needs confirmation.
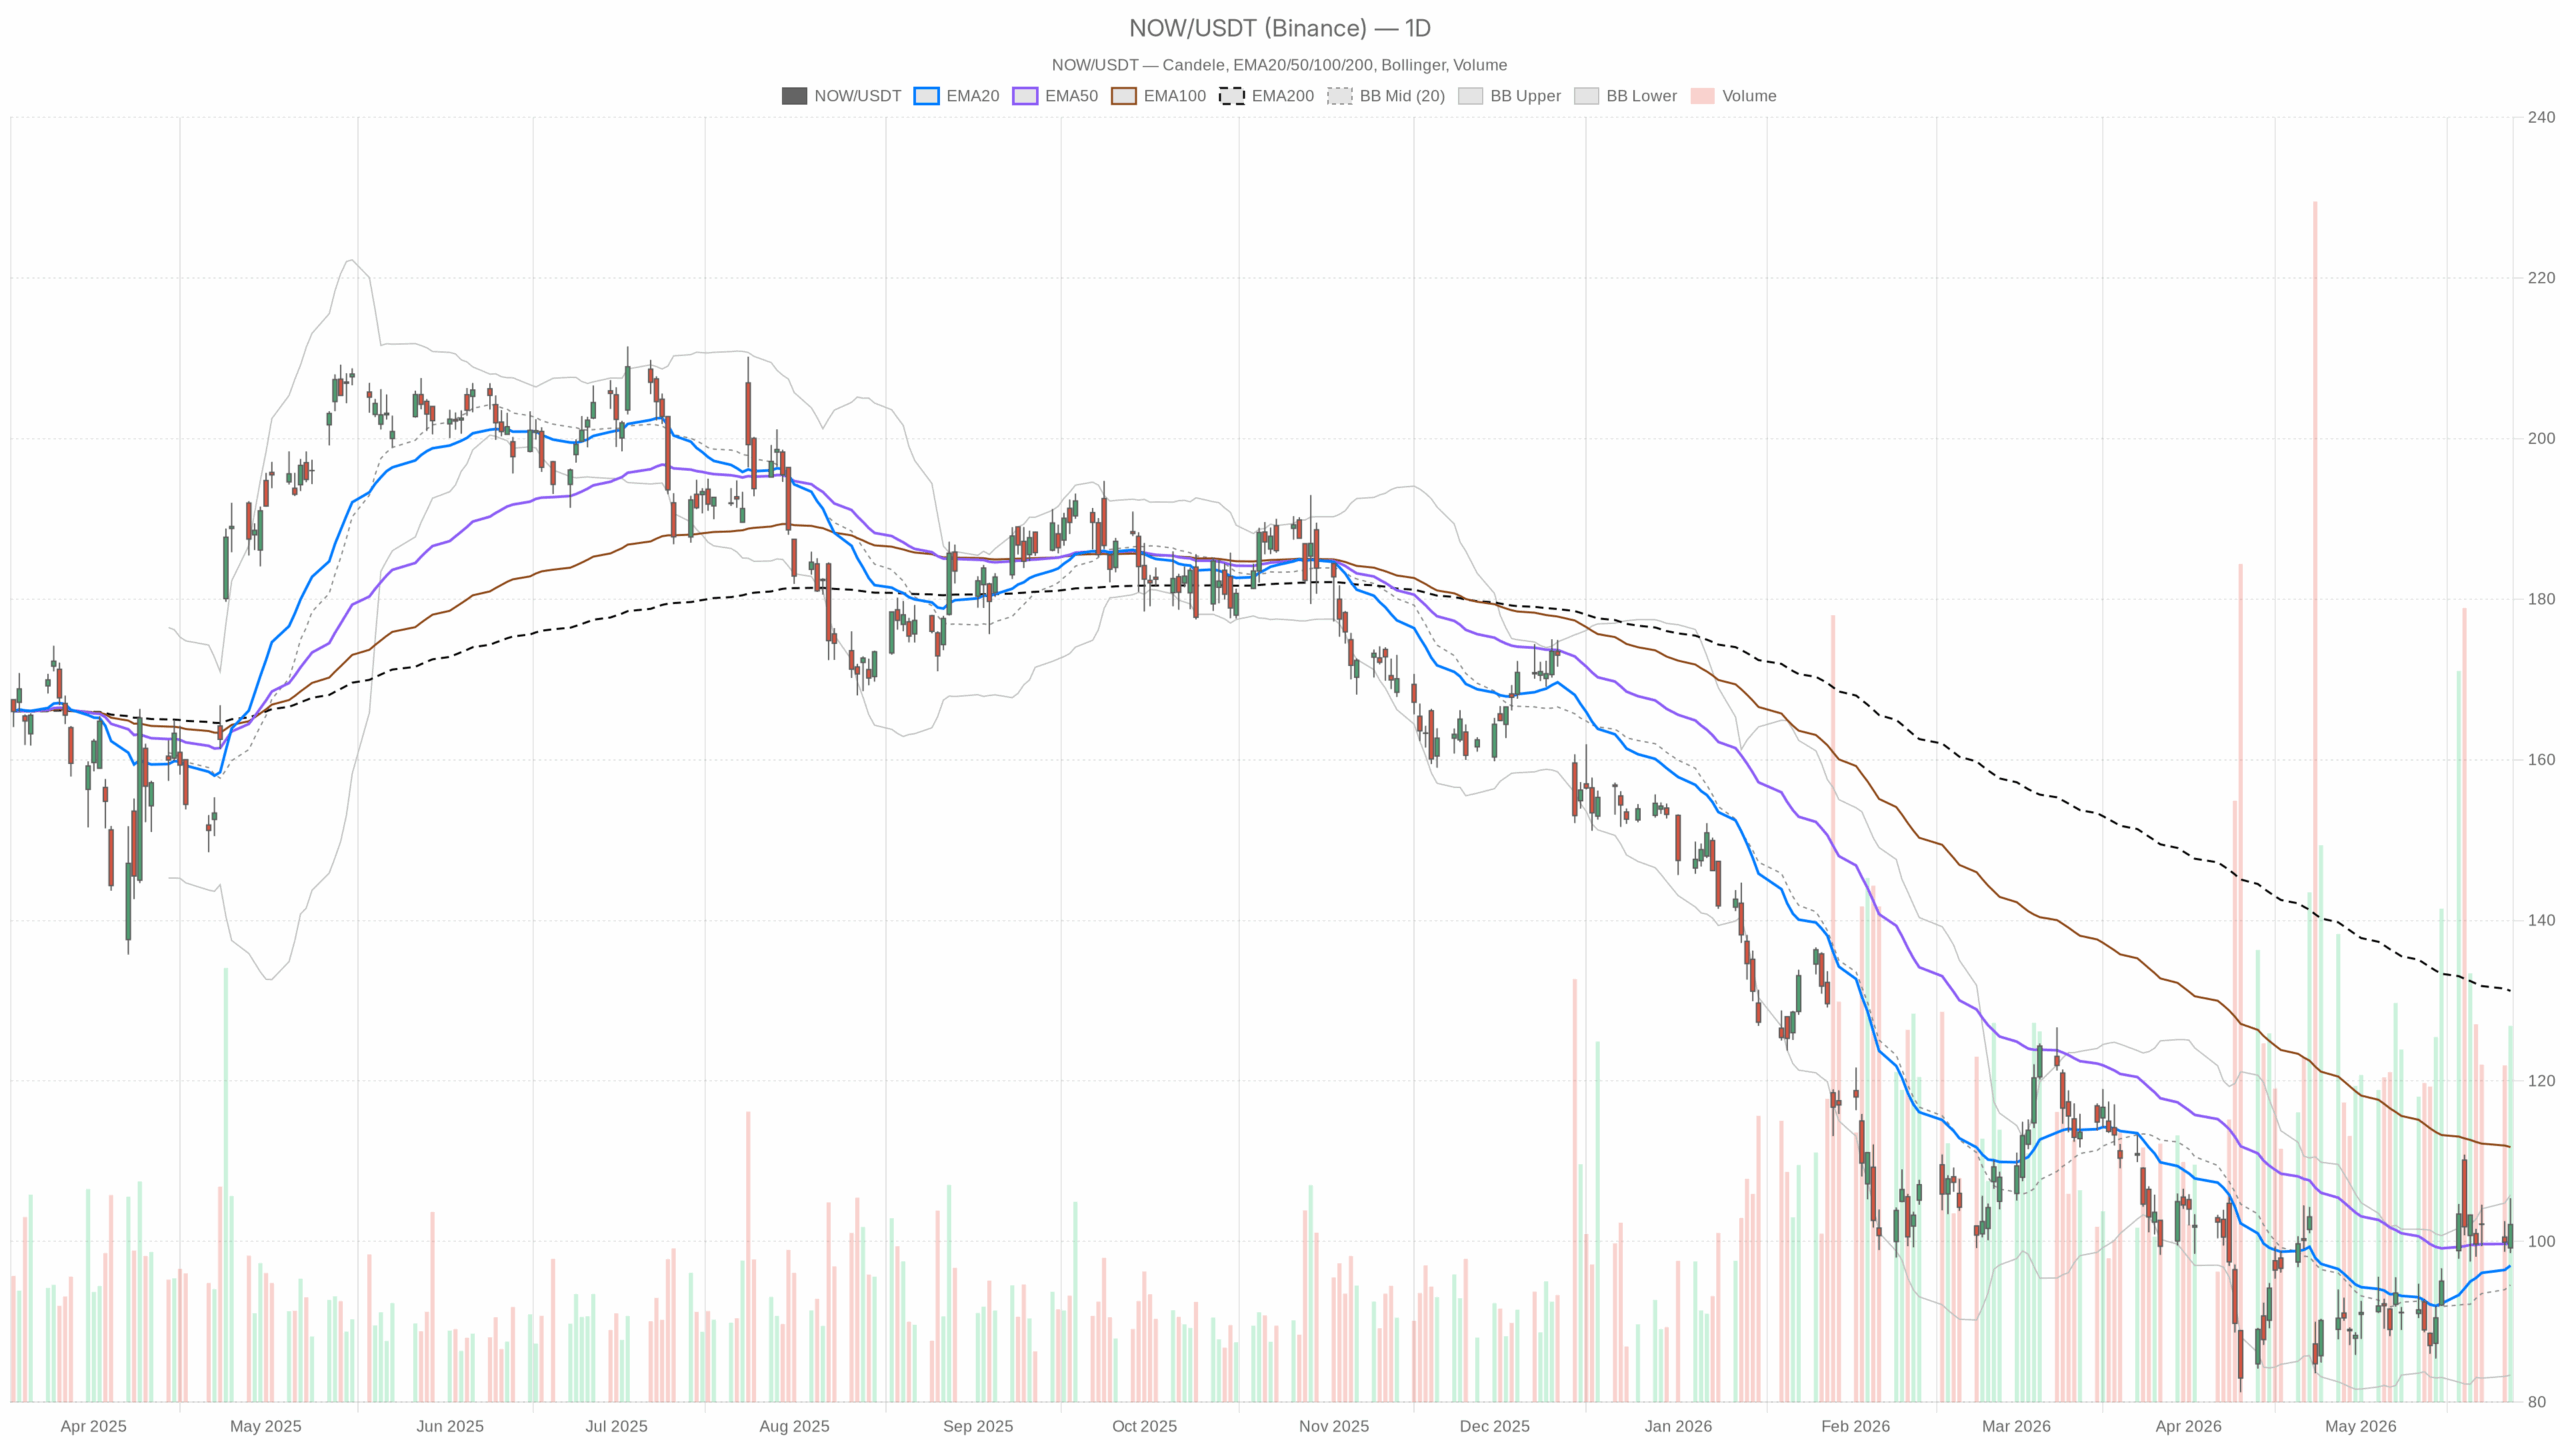 NOW — Daily candlestick chart, with EMA20/EMA50 and trading volume
Market hypothesis: tactical neutrality and nearby resistance
The ServiceNow stock is recovering in an orderly way, with buying supporting pullbacks, but the main trend remains fragile. This moment is important because the price is moving near the 102.02 pivot and below the supply zone concentrated between 105.4–105.8. A clear breakout of this area would change the pace of the price, while as long as it continues to be rejected above that zone, the market will continue to favor a sideways accumulation move.
Daily trend of the ServiceNow stock: above short-term EMAs, but far from the 200 line
On the D1 timeframe, the stock is moving in the 98.55–105.4 range with a trading volume of 26,358,611. The price is above the EMA20 97 and the EMA50 99.78, but still well below the EMA200 131.21: it is a credible short-term rebound, but the structural reversal is still far away.
RSI 57.03 confirms a positive and constructive momentum without being excessively overheated, in line with a possible further move towards resistance as long as it holds above the 50 area. The MACD (value line 1.57, signal 0.16, histogram +1.41) shows a strengthening driving force, supporting the attempt at a breakout if recent highs are tested with closes in the upper part.
The Bollinger Bands (middle line 94.58, upper band 105.8, lower band 83.36) are containing a price located in the upper third of the channel: there is still technical room to test the upper band, but the proximity to the 105.5–105.8 area suggests caution regarding possible profit-taking. The PP 102.02 was recovered at the close: above the pivot, the balance point tilts slightly to the buyers’ side.
H1 timeframe: momentum holds as long as 102 continues to hold
In the short term, the structure on the hourly timeframe remains positive: the price is above the EMA20 H1 102 and the Bollinger middle line at 102.03. As long as the 101.9–102.2 area is defended, pullbacks will attract buying and the flow will remain positive. However, the direction of the move starts to lose momentum as it approaches the 105 area, where the daily timeframe has already shown signs of rejection.
15-minute timeframe: mixed pressures and the 102 area as a point of attraction
On the 15-minute timeframe, the market tone is less clear: the RSI 44.56 indicates a weakening of momentum in the very short term. The 102.0–102.2 area remains the operational balance point, with quick alternations between rebounds and false breakouts. Repeated rejections above 103 without volume support favor a return to the pivot; conversely, a clear base above 102.2 would prepare the ground for a new test of resistances.
Bullish scenario for the ServiceNow stock
To unlock the next leg, the following is needed: maintaining closes above the PP 102.02, an ascending sequence of highs on the hourly timeframe and a determined attack on R1 105.5. A daily close above 105.5–105.8 (resistance and upper band) would confirm a bullish extension, with follow-through supported by a D1 RSI bouncing above 60 and a MACD with an expanding histogram in positive territory. In that case, the stock would confirm a constructive view and open room for a gradual extension as long as volatility allows.
Bearish scenario: what would invalidate the recovery
A return below 102 would weaken the short-term picture. A clear break of S1 98.65 would bring the price back to the center of the swing range, with the risk of sliding towards the Bollinger middle line at 94.58. A daily close below 94.6, with an RSI below 50 and a flat or descending MACD, would open room towards the lower band at 83.36. The ATR14 5.84 should not be underestimated: high volatility amplifies false signals around support and resistance levels, both static and dynamic.
Context reading and levels to watch in NOW
Today the ServiceNow stock market indicates a neutrality slightly tilted to the upside: above the pivot, the buyers’ side has a small advantage, but the 105.4–105.8 area remains the dividing line of the market view. Uncertainty persists between short-term dynamic supports and nearby daily resistances, in a context of wide volatility.
Levels that traders are watching: 102.02 as the intraday balance point, 105.5–105.8 as key resistance, 98.65 as main support and 94.58 as the midpoint of the price range. As long as the ServiceNow price respects this map, the reading will remain operational and anchored to momentum rather than the underlying direction.









 English (US) ·