
 1 month ago
76
1 month ago
76

Tesla stock is attempting a bounce, but the daily chart remains bearish. After closing at $322.08 on Monday, shares sit below all major daily moving averages. The post-earnings rally has sparked short-term enthusiasm, yet the higher-timeframe trend structure has not flipped.
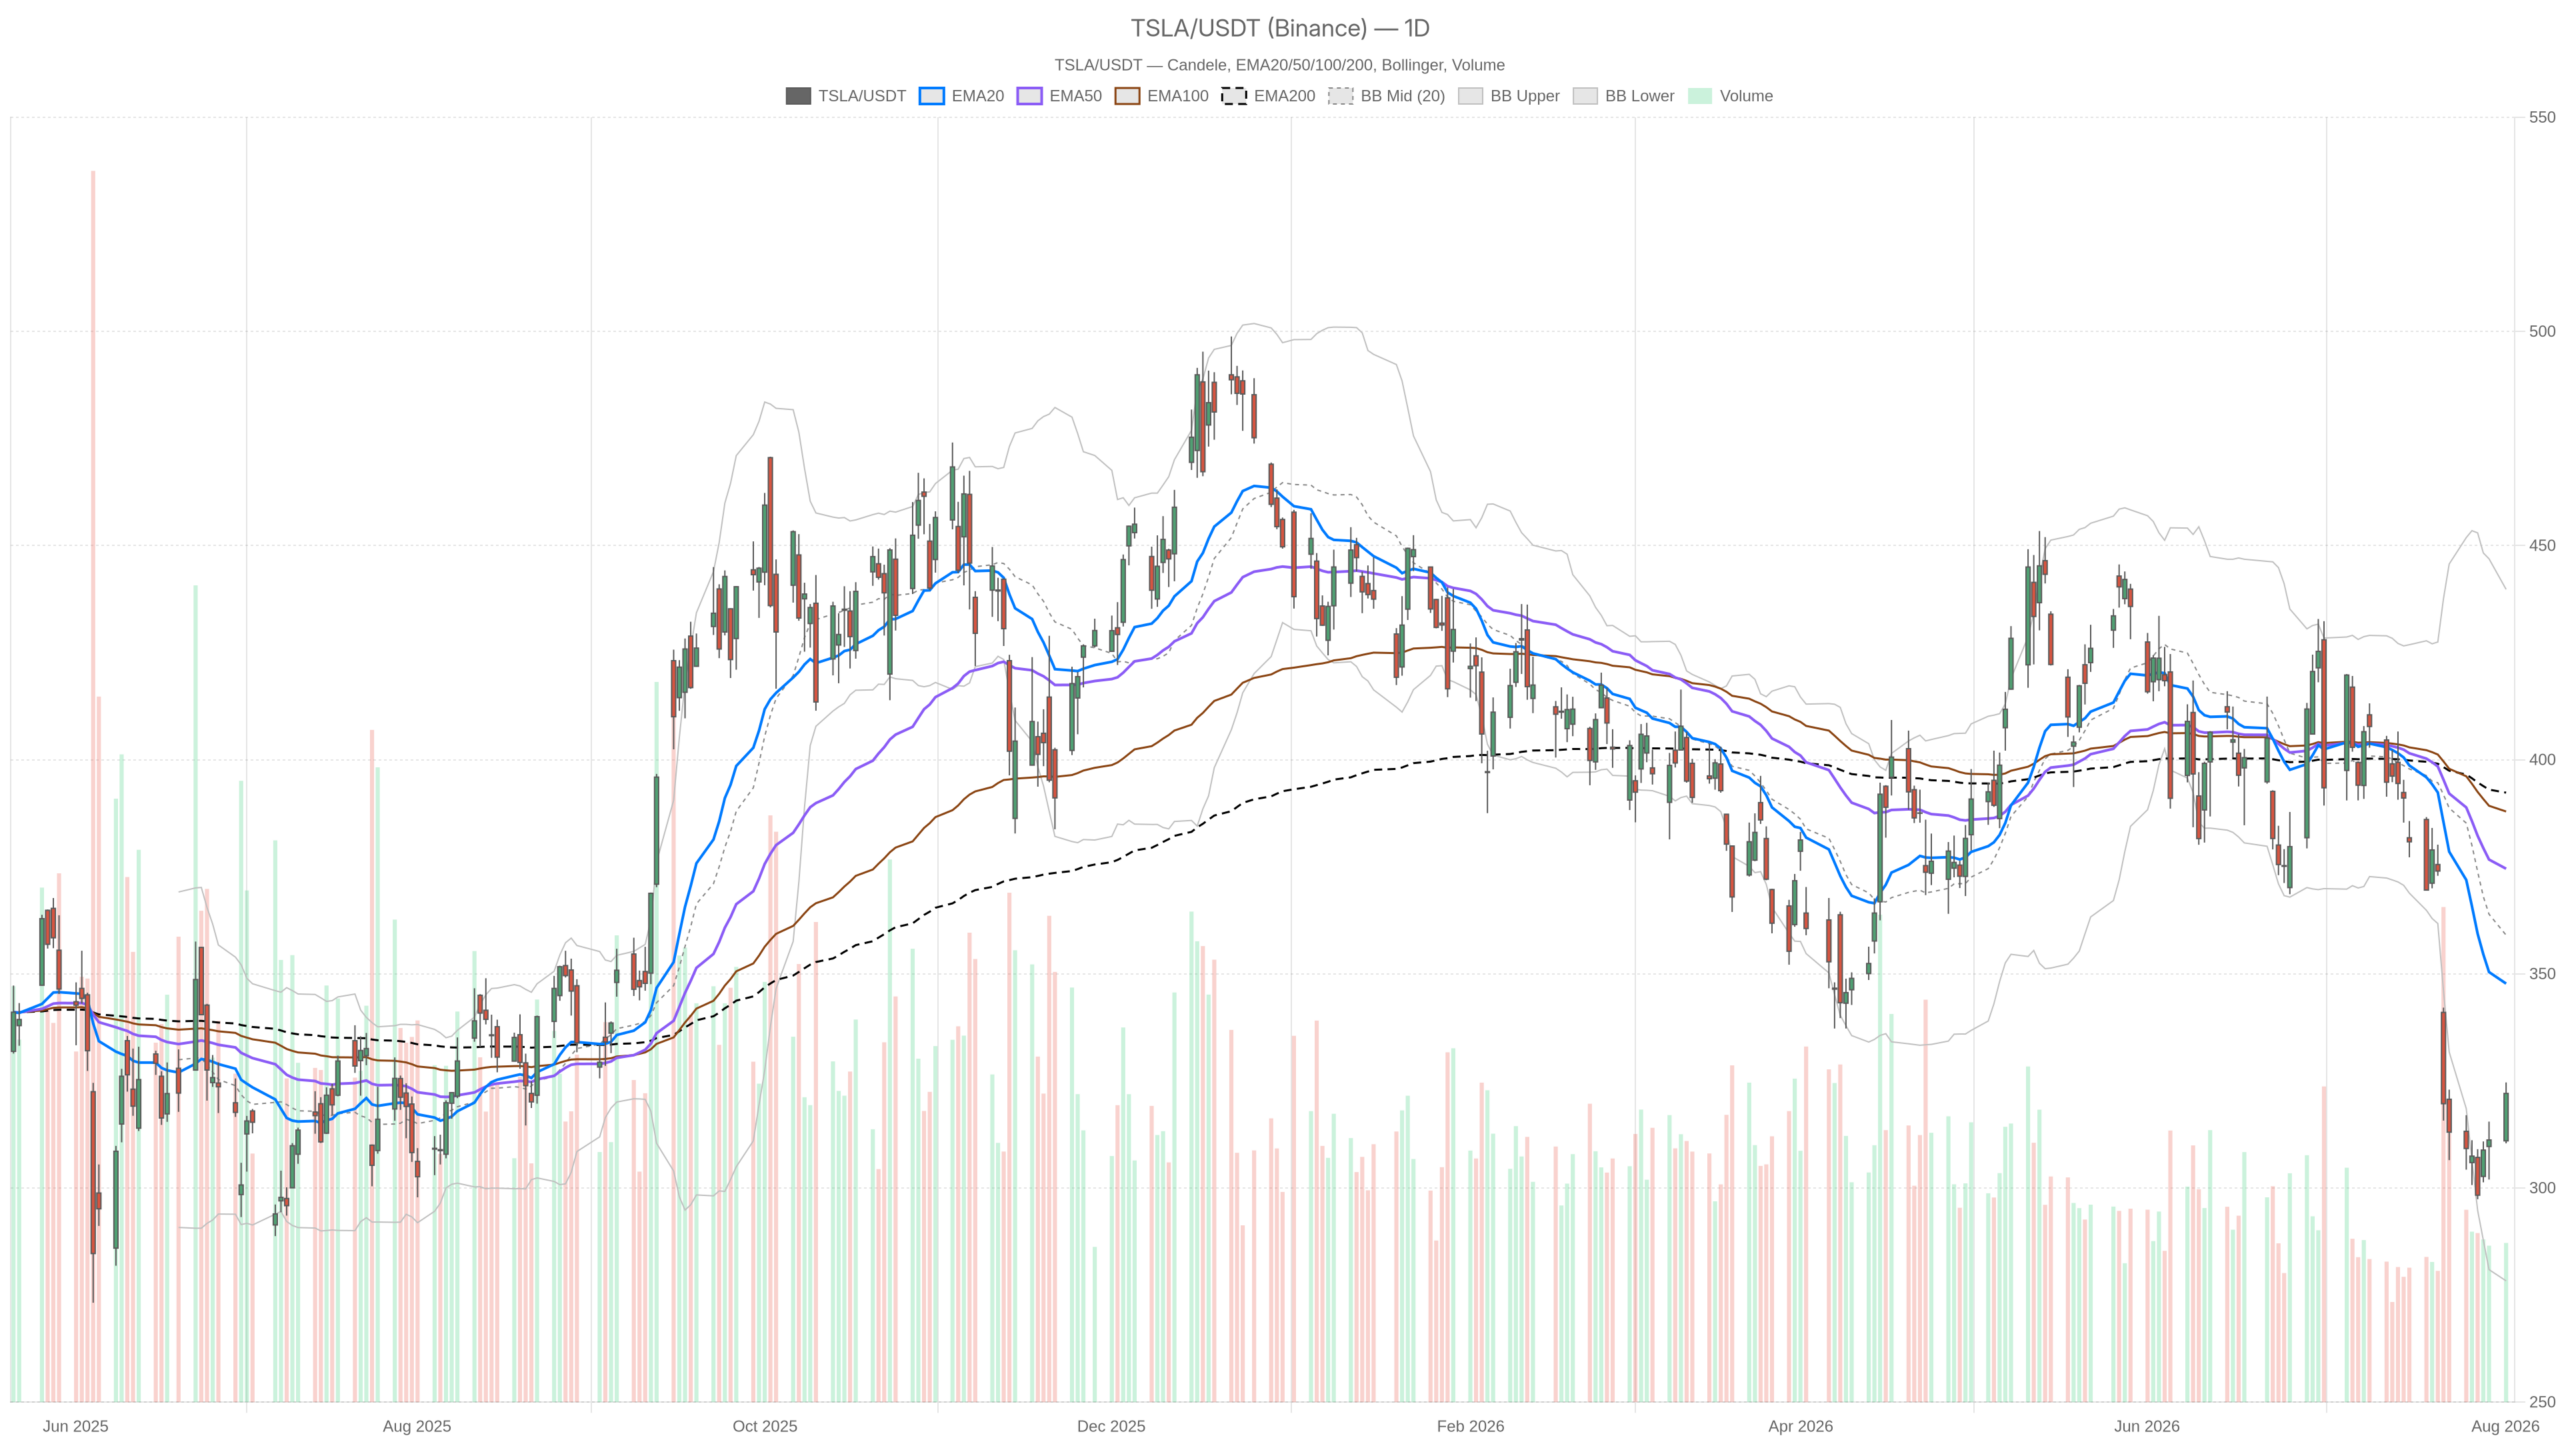 TSLA — daily chart with candlesticks, EMA20/EMA50 and volume.
Key takeaways
- Tesla stock closed at $322.08, below the EMA20, EMA50, and EMA200 on the daily chart
- Daily RSI at 36.83 reflects weak momentum without being deeply oversold
- Hourly momentum is bullish with RSI at 64.41, conflicting with the daily bearish structure
- Daily ATR14 of 16.33 signals elevated volatility remains the base case
- Tesla registrations in Italy dropped 77% in July, raising demand concerns
Tesla Stock Daily Structure: Still a Downtrend Beneath the Bounce
Yes, Tesla stock remains in a daily downtrend despite the bounce. Price at $322.08 sits below every major moving average, confirming a textbook bearish alignment.
On the daily chart, Tesla stock trades at $322.08, sitting below the EMA20 at $347.72, the EMA50 at $374.55, and the EMA200 at $392.32. That stacking of moving averages above price confirms the dominant trend has been down since the recent top. The current bounce has not yet damaged that structure.
The daily RSI reads 36.83, soft but not deeply oversold. This leaves room for either further downside or a relief rally. Meanwhile, MACD reinforces the cautious view: the line sits at -24.71, below the signal at -19.98, with a histogram of -4.74. Daily momentum remains negative, even if recent price action has started narrowing the gap.
Bollinger Bands show a mid-line at $359.05, with price positioned well below it. That is consistent with sustained selling pressure. Daily ATR14 stands at 16.33, reminding traders that swings of that magnitude remain possible in either direction. Daily pivot levels place the pivot point at $319.05, with resistance at $327.68 (R1) and support at $313.45 (S1). Tesla stock currently trades above the pivot but below R1. This means bulls have reclaimed near-term ground without breaking into clearly bullish territory.
1H Momentum: A Genuine Conflict With the Daily Bias
The 1H chart on Tesla stock shows genuine bullish momentum that conflicts with the daily bearish bias. Short-term buyers are in control, but this has not yet flipped the larger trend.
The hourly chart tells a very different story from the daily one. On the 1H timeframe, the regime is neutral rather than bearish. Price at $322.13 trades above both the EMA20 at $315.19 and the EMA50 at $319.40. However, it remains below the EMA200 at $359.62. Even this shorter-term strength is not a full trend reversal signal.
RSI on the 1H chart sits at 64.41, a bullish reading reflecting the recent bounce’s strength. Notably, MACD confirms that momentum, with the line at 3.25 above the signal at 1.52. The positive histogram of 1.73 shows short-term buyers are firmly in control. The 1H Bollinger Bands show price pressing toward the upper band at $326.49. This supports the idea that the rally leg still carries momentum on an intraday basis.
Hourly pivot data puts the pivot point at $322.18, essentially where price is trading. R1 at $323.15 and S1 at $321.15 form a tight band. Therefore, the conflict between timeframes is explicit. Daily structure says downtrend, while hourly momentum says short-term strength. This is the profile of a corrective bounce inside a larger bearish trend. It is not yet confirmed evidence of a full reversal.
15-Minute Execution Context
The 15-minute chart signals consolidation rather than a clear directional push. Tightly bunched EMAs and narrow Bollinger Bands suggest the market is pausing after the recent rally.
On the 15-minute chart, the regime is neutral and the EMAs are tightly bunched: EMA20 at 321.23, EMA50 at 317.06, and EMA200 at 320.12. That clustering suggests consolidation rather than a clear directional push at this granular level.
Meanwhile, RSI on the 15m chart sits at 58.9, a moderate reading with no extreme skew. MACD shows the line at 1.83 just under the signal at 2.27, with a slightly negative histogram of -0.44. That is a subtle signal of fading short-term momentum, hinting at a pause after the recent push higher.
The 15m Bollinger Bands are notably narrow. The mid-line sits at 322.31, with the upper band at 324.05 and the lower band at 320.57. Low ATR14 of 1.33 on this timeframe confirms the compression. In practical terms, Tesla stock is catching its breath. The pivot at 321.97, resistance at 322.74, and support at 321.36 define the immediate battleground for intraday positioning.
News Flow: A Bull Turns Cautious, and Demand Questions Persist
The news backdrop surrounding Tesla stock is notably mixed. A prominent bull turned cautious after the stock broke below $300, while robotaxi optimism and demand concerns pull in opposite directions.
Tesla shares surged on Monday, August 3, as investors extended last week’s post-earnings rally. Notably, analysts at Stifel Nicolaus, one of the biggest Tesla bulls on Wall Street, are reportedly turning more cautious. Their shift came after the stock dipped below its support level at $300. That kind of change from a longstanding bull carries weight, even amid a bounce.
On the other hand, a more constructive narrative is building around Tesla’s robotaxi progress. Commentary suggests a reset in rollout expectations could actually benefit the stock over the medium term. At the same time, a separate piece flags that Tesla’s biggest growth promises now need financial proof. This frames the coming period as a critical test for the company’s execution.
Fundamentally, there are also demand concerns to weigh. Tesla registrations in Italy dropped 77% in July. That data point stands in contrast to the recent share price strength. It also underscores why some analysts remain skeptical despite the rally.
Tesla Stock Bullish Scenario
For Tesla stock’s bullish case to gain real traction, price must reclaim the daily EMA20 at $347.72 and clear daily R1 at $327.68. That would start eroding the bearish daily regime.
In parallel, the 1H timeframe would need to hold above its EMA50 at $319.40. It must also keep RSI above the 50 threshold to preserve the momentum currently in place. A shift of the daily MACD histogram toward positive territory would provide the clearest confirmation. That would signal buyers have taken control beyond just an intraday bounce.
Tesla Stock Bearish Scenario
The bearish scenario activates if Tesla stock fails to hold the 1H EMA20 at $315.19 or the hourly pivot support at $321.15. That would open the door back toward daily S1 at $313.45.
Over time, the lower daily Bollinger Band at $278.31 would come into play. A break back below the $300 level would be particularly significant. It would validate the renewed caution from Stifel Nicolaus. This would likely reassert the daily downtrend as the dominant force, invalidating the current bounce narrative.
Closing Take
Tesla stock is caught between a bearish daily chart and bullish hourly momentum. Elevated volatility and mixed Wall Street signals suggest the path forward remains genuinely uncertain.
Overall, positioning here demands respect for both sides of the argument. Daily ATR14 at 16.33 points to a market where volatility should remain the base case rather than the exception. Meanwhile, a prominent bull’s more cautious tone alongside softer international demand data reinforces the uncertainty. The resolution will come when price action on the daily chart resolves this conflict one way or the other.
FAQ
Is Tesla stock still in a daily downtrend?
Yes. On the daily chart, Tesla stock remains in a downtrend. Price at $322.08 sits below the EMA20 at $347.72, the EMA50 at $374.55, and the EMA200 at $392.32. This forms a textbook bearish alignment that the current bounce has not yet reversed.
Why does the hourly chart conflict with the daily outlook?
The hourly chart shows bullish short-term momentum with RSI at 64.41 and MACD in positive territory. Price trades above the 1H EMA20 and EMA50. However, it remains below the EMA200. This suggests a corrective bounce within the larger daily downtrend, not a confirmed reversal.
What are the key levels to watch for Tesla stock?
For bulls, Tesla stock must reclaim the daily EMA20 at $347.72 and clear R1 at $327.68. For bears, failure to hold the 1H EMA20 at $315.19 or the hourly pivot support at $321.15 would open the door toward daily S1 at $313.45. A break below $300 would be particularly significant.
Disclaimer: This article is for informational purposes only and does not constitute financial advice, an investment recommendation, or a solicitation to buy or sell any financial instrument or cryptocurrency. The analysis provided is not indicative of future results. Investing in crypto assets and financial markets carries a high risk of capital loss. Always do your own research (DYOR) and consult a qualified financial advisor before making any decision.
Article produced with the assistance of artificial intelligence and reviewed by the editorial team.







 English (US) ·