
 1 month ago
82
1 month ago
82

USA Rare Earth, Inc. stock closed at $14.15 on July 24, 2026. Price sits deep below key moving averages, pressing against the lower daily Bollinger Band. The technical picture across timeframes is unmistakably bearish. Yet beneath the deterioration, strategic corporate developments are building a longer-term narrative worth watching.
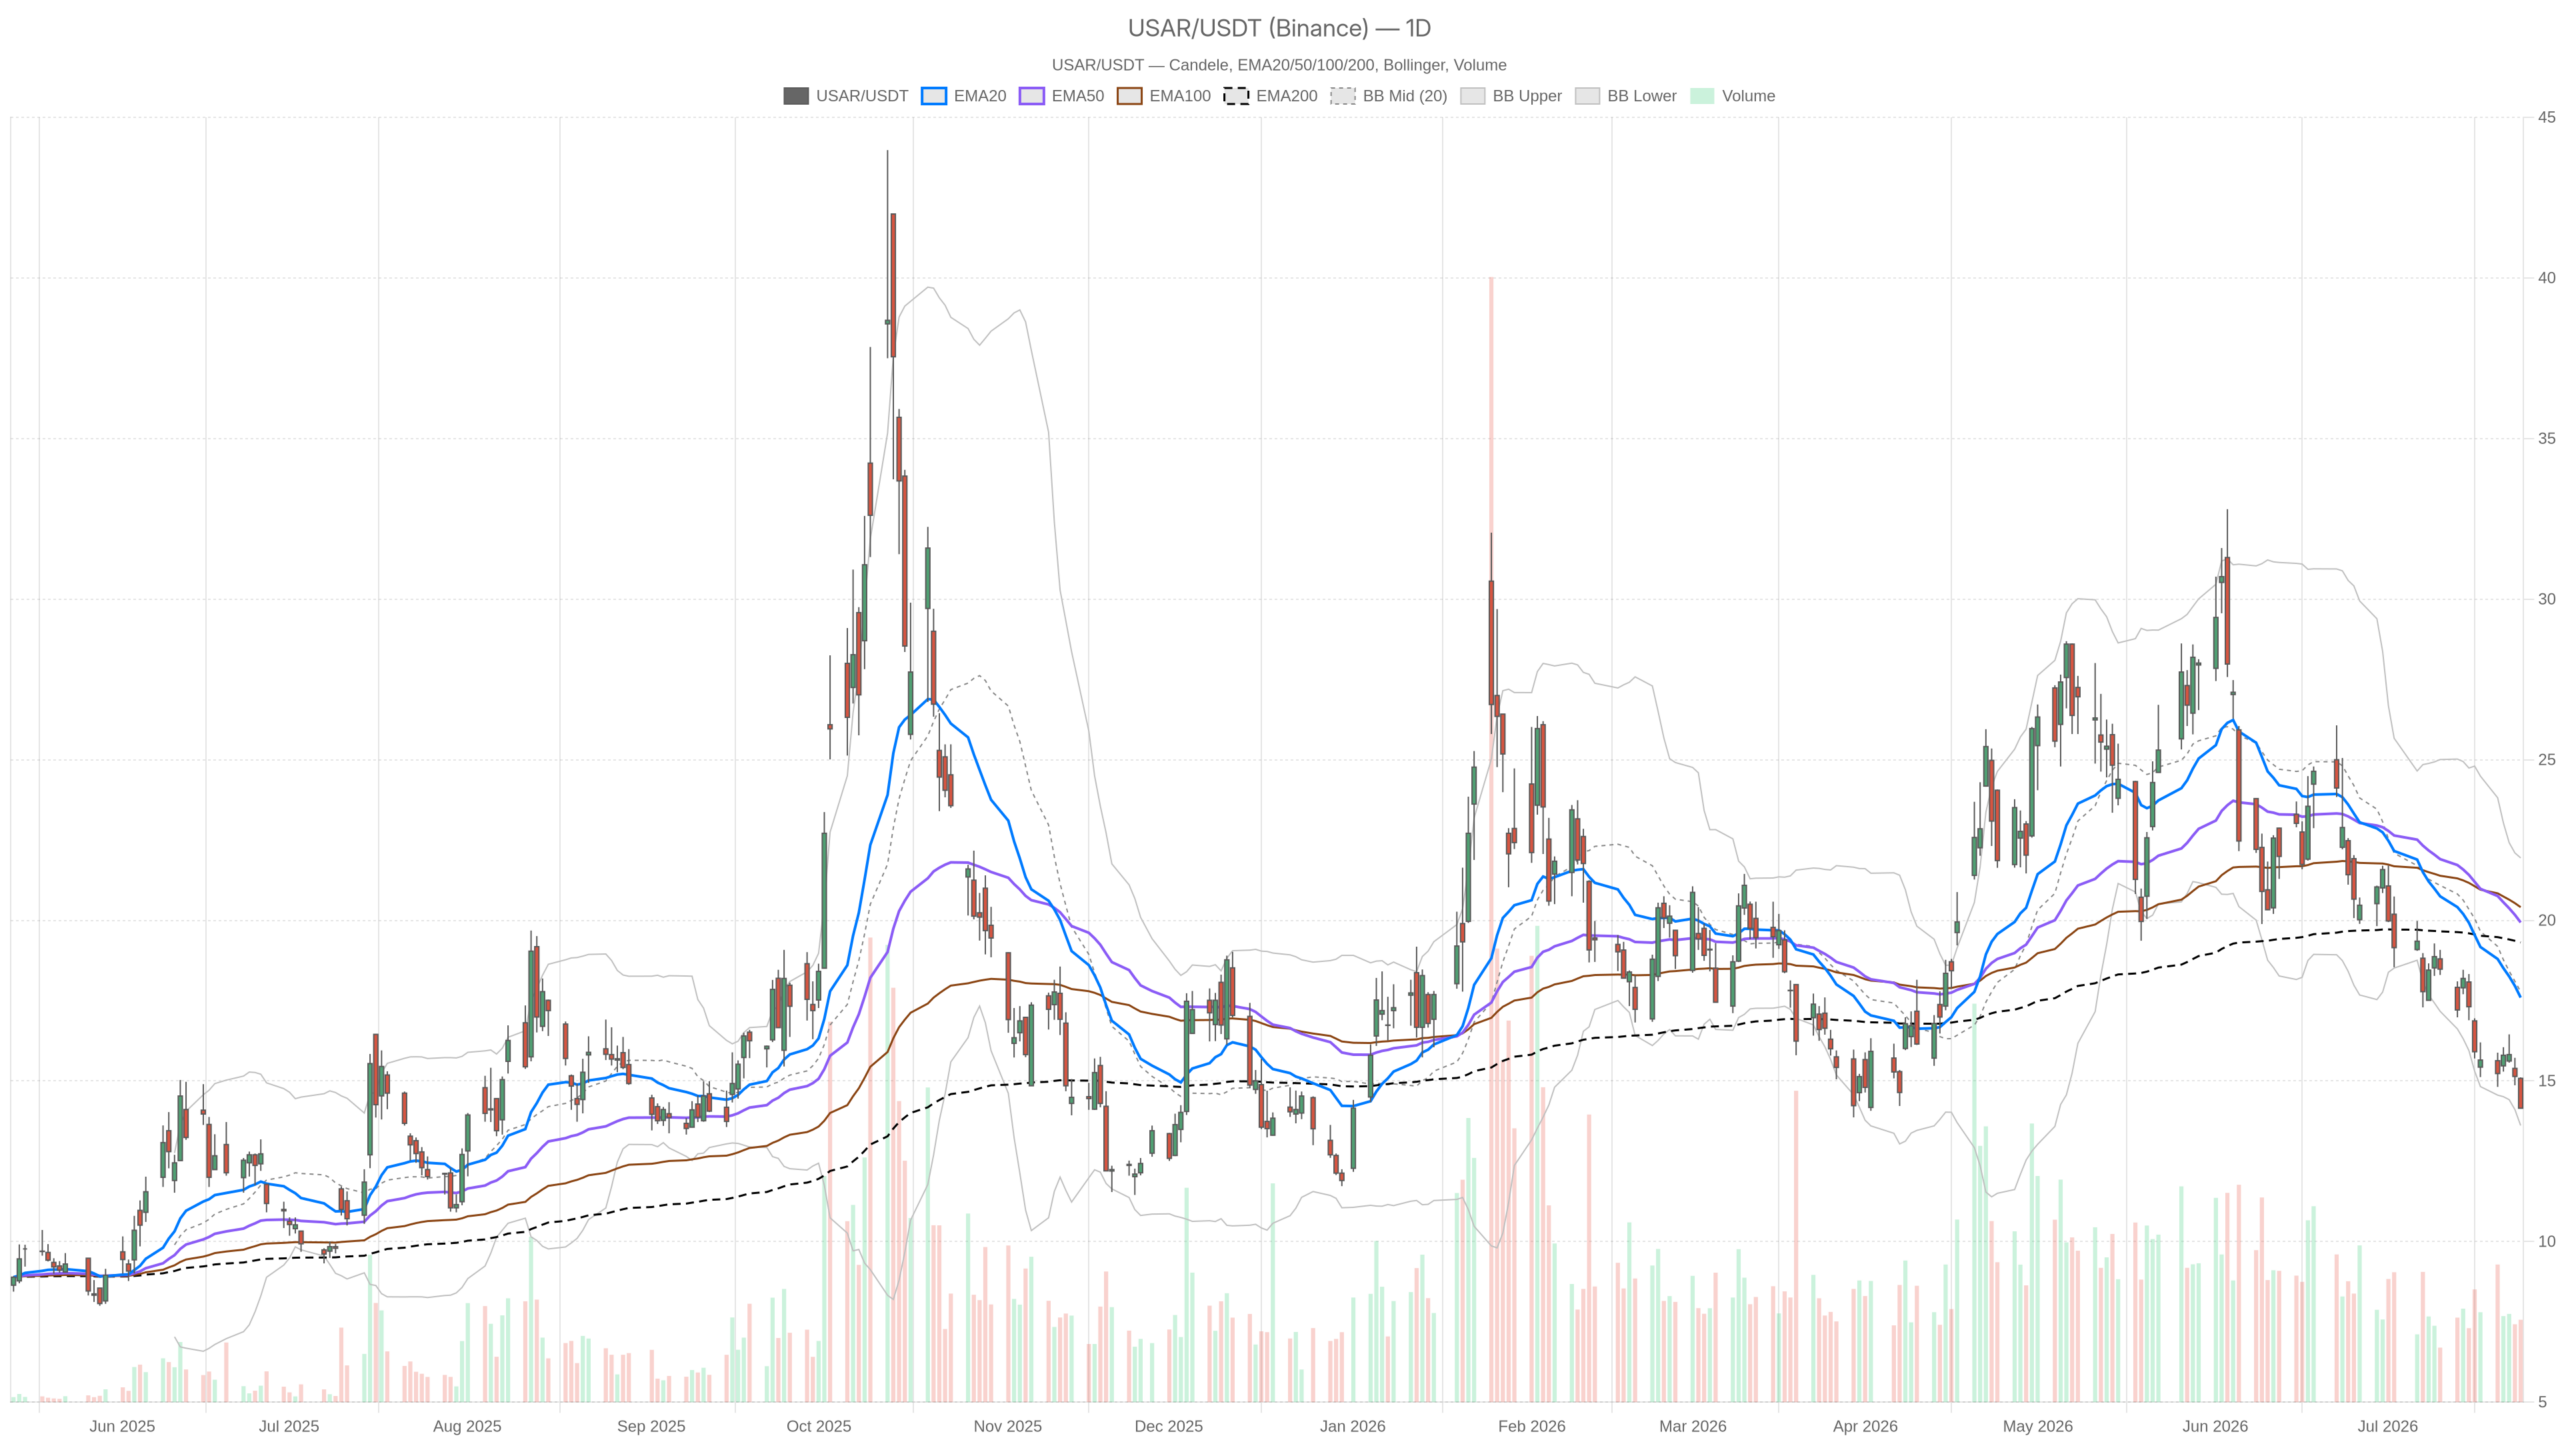 USAR — daily chart with candlesticks, EMA20/EMA50 and volume.
Key takeaways
- USAR closed at $14.15 on July 24, 2026, trading below all three daily EMAs — the 20-day at $17.60, 50-day at $19.93, and 200-day at $19.31.
- Daily RSI sits at 30.29 — hovering near oversold — while the MACD histogram at -0.18 confirms active bearish momentum.
- The 1H timeframe is flagged as explicitly bearish, with RSI at 28.97 and price below every hourly EMA.
- A CEO transition is underway: Barbara Humpton retires; Thras Moraitis becomes CEO effective October 1, 2026, with Michael Blitzer named Executive Chairman.
- Daily pivot stands at $14.47; a close above $14.79 (R1) would provide the first constructive signal.
Daily Timeframe: USAR in Oversold Territory but Not Yet Reversing
USAR is in a confirmed downtrend on the daily chart. Price at $14.15 sits below the 20-day EMA at $17.60, the 50-day EMA at $19.93, and the 200-day EMA at $19.31. That is a classic bearish stack — signaling sustained distribution rather than a temporary pullback.
The daily RSI at 30.29 hovers at the edge of oversold territory. While this signals exhaustion in selling momentum, it does not confirm a reversal on its own. Meanwhile, the MACD line at -1.95 versus a signal of -1.77 produces a histogram of -0.18. The spread is modestly widening, meaning bearish momentum remains technically active.
Bollinger Bands show a midline at $17.78 and a lower band at $13.61. At $14.15, USAR is hugging the lower band — a zone that historically attracts mean-reversion attempts. However, walking the lower band is a known pattern during persistent downtrends. The ATR at $1.19 confirms elevated daily volatility.
Overall, the daily regime is flagged as neutral — a meaningful nuance given the otherwise bearish tilt. Pivot analysis places the pivot point at $14.47, with R1 at $14.79 and S1 at $13.82. USAR closed below the daily pivot, keeping the immediate path of least resistance to the downside. A close above $14.79 would be the first constructive signal worth tracking.
Hourly Confirmation: Bears Are in Control Short-Term
Are bears still in control intraday? Unambiguously yes. The 1H chart shows price at $14.15 — below the 20H EMA at $14.93, the 50H EMA at $15.65, and the 200H EMA at $18.79. Meanwhile, that full EMA cascade confirms the daily weakness is not a one-session anomaly.
The hourly RSI sits at 28.97 — technically in oversold territory. The MACD on this frame reads a line of -0.42 versus a signal of -0.33, with a negative histogram of -0.09. Selling pressure remains intact with no meaningful deceleration. The hourly Bollinger lower band rests at $13.84, so price is again pressing the lower boundary.
In contrast to the daily setup, the hourly frame offers no ambiguity. The 1H regime is explicitly flagged as bearish, providing direct confirmation of the daily thesis. There is no RSI divergence, no MACD crossover attempt, and no reclaim of any relevant EMA. Any bounce that fails to clear the $14.93 hourly EMA should be treated with skepticism.
15-Minute Context: Flat Momentum at Session Lows
Is there any sign of a reversal on the micro timeframe? None. The 15M chart shows USAR closing at $14.15 with all EMAs in a bearish stack. The 20-period sits at $14.39, the 50-period at $14.74, and the 200-period at $15.72. The 15M RSI at 29.94 mirrors the oversold conditions seen across other timeframes.
Notably, the MACD histogram on this frame sits exactly at zero. This suggests a brief pause in directional momentum rather than any genuine recovery attempt. The 15M Bollinger lower band at $14.12 nearly touches the close, while ATR is just $0.10 — compressed volatility at the micro level. This is not accumulation. It reads as exhaustion into the close.
Overall, pivot support on the 15M frame rests at $14.13, with immediate resistance at $14.20. Until price breaks and holds above that micro-resistance, there is no tactical reason to expect a near-term bounce.
Fundamental Backdrop: Strategic Moves Compete With USAR’s Price Reality
Does the fundamental story offset the bearish technicals? Not yet. USA Rare Earth, Inc. stock has attracted attention for reasons beyond its chart. The company announced that Barbara Humpton will retire and Thras Moraitis will become CEO, both effective October 1, 2026. Michael Blitzer has been elected Executive Chairman effective immediately. Leadership transitions can inject near-term uncertainty — and USAR is no exception.
At the same time, the company strengthened its mine-to-magnet strategy through the Serra Verde acquisition. This move aligns directly with the broader push for domestic rare earth and critical mineral supply chains. Earlier in the week, USAR also gained premarket on optimism around defense critical metals policy. Investors clearly see medium-term potential in domestic rare earth producers.
Therefore, a clear tension exists. Strategic optimism embedded in the news flow contrasts sharply with price action telling a very different story. Artisan Partners’ Artisan Small Cap Fund highlighted USAR in its Q2 2026 investor letter. That signals institutional interest at current levels, even as the stock continues losing ground technically.
Bullish Scenario: What Would Need to Change for USAR
What would turn USA Rare Earth, Inc. stock bullish? A credible case exists — but it requires technical confirmation. RSI oversold readings across all three timeframes simultaneously create the conditions for a mean-reversion bounce. This is particularly true if positive news around the Serra Verde acquisition or critical minerals policy accelerates.
A recovery above the daily pivot at $14.47, followed by a hold above $14.79 (R1), would provide the first structural evidence that selling pressure is genuinely subsiding. Beyond that, reclaiming the 20-day EMA at $17.60 would shift the medium-term narrative meaningfully.
Still, the institutional backing highlighted by Artisan Partners and the macro tailwind from defense-driven critical metals demand provide fundamental fuel for such a move. But price needs to confirm before that thesis carries weight.
Bearish Scenario: Where the Downside Risk Lives
Where is the downside risk? It remains concrete. If USAR fails to hold above the daily lower Bollinger Band at $13.61, the next significant technical reference becomes S1 at $13.82. A close below $13.82 would suggest the oversold condition is not enough to arrest the decline.
Given the ongoing MACD negative spread at the daily level and the unambiguously bearish 1H regime, sellers retain full control of the tape. Moreover, the leadership transition introduces execution risk. New CEO transitions, even well-telegraphed ones, tend to generate a wait-and-see attitude among institutional buyers. This removes a potential demand catalyst in the short term.
If macro sentiment around critical metals cools or policy catalysts fade, USAR has limited technical support standing between current prices and further deterioration.
Positioning and Volatility Outlook
How should traders approach USAR? With patience and confirmation. The technical picture across all timeframes is bearish to neutral. Oversold readings warn of exhaustion but provide no confirmed reversal signal. Daily volatility remains elevated at an ATR of $1.19 — wide enough to make sizing decisions non-trivial.
The fundamental story is genuinely interesting, built around a mine-to-magnet strategy, a high-profile acquisition, and a favorable policy environment. However, interesting stories and constructive price action do not always arrive at the same time. Until USAR reclaims the daily pivot and begins closing above short-term EMAs, the path of least resistance remains lower.
FAQ
Is USA Rare Earth, Inc. stock in a downtrend?
Yes. As of July 24, 2026, USAR closed at $14.15, trading below its 20-day EMA ($17.60), 50-day EMA ($19.93), and 200-day EMA ($19.31). This bearish EMA stack confirms sustained distribution rather than a temporary pullback.
What are the key support levels for USAR?
The immediate support is the daily lower Bollinger Band at $13.61, followed by the daily S1 pivot at $13.82. A close below $13.82 would signal that oversold conditions are insufficient to halt the decline.
What fundamental catalysts could lift USA Rare Earth, Inc. stock?
The Serra Verde acquisition strengthens the company’s mine-to-magnet strategy. Additionally, defense-driven critical metals policy optimism and institutional interest — including from Artisan Partners’ Small Cap Fund — provide medium-term tailwinds.
Who is the new CEO of USA Rare Earth, Inc.?
Thras Moraitis will become CEO effective October 1, 2026, succeeding Barbara Humpton. Michael Blitzer has been named Executive Chairman effective immediately.
Disclaimer: This article is for informational purposes only and does not constitute financial advice, an investment recommendation, or a solicitation to buy or sell any financial instrument or cryptocurrency. The analysis provided is not indicative of future results. Investing in crypto assets and financial markets carries a high risk of capital loss. Always do your own research (DYOR) and consult a qualified financial advisor before making any decision.
Article produced with the assistance of artificial intelligence and reviewed by the editorial team.






 English (US) ·