
 13 hours ago
14
13 hours ago
14

Verizon stock faces mounting selling pressure heading into mid-June. VZ closed at $45.37, below the 20-day EMA at $46.74 and the 50-day EMA at $47.09. The 200-day EMA at $45.47 has been essentially breached, tilting the daily bias firmly bearish.
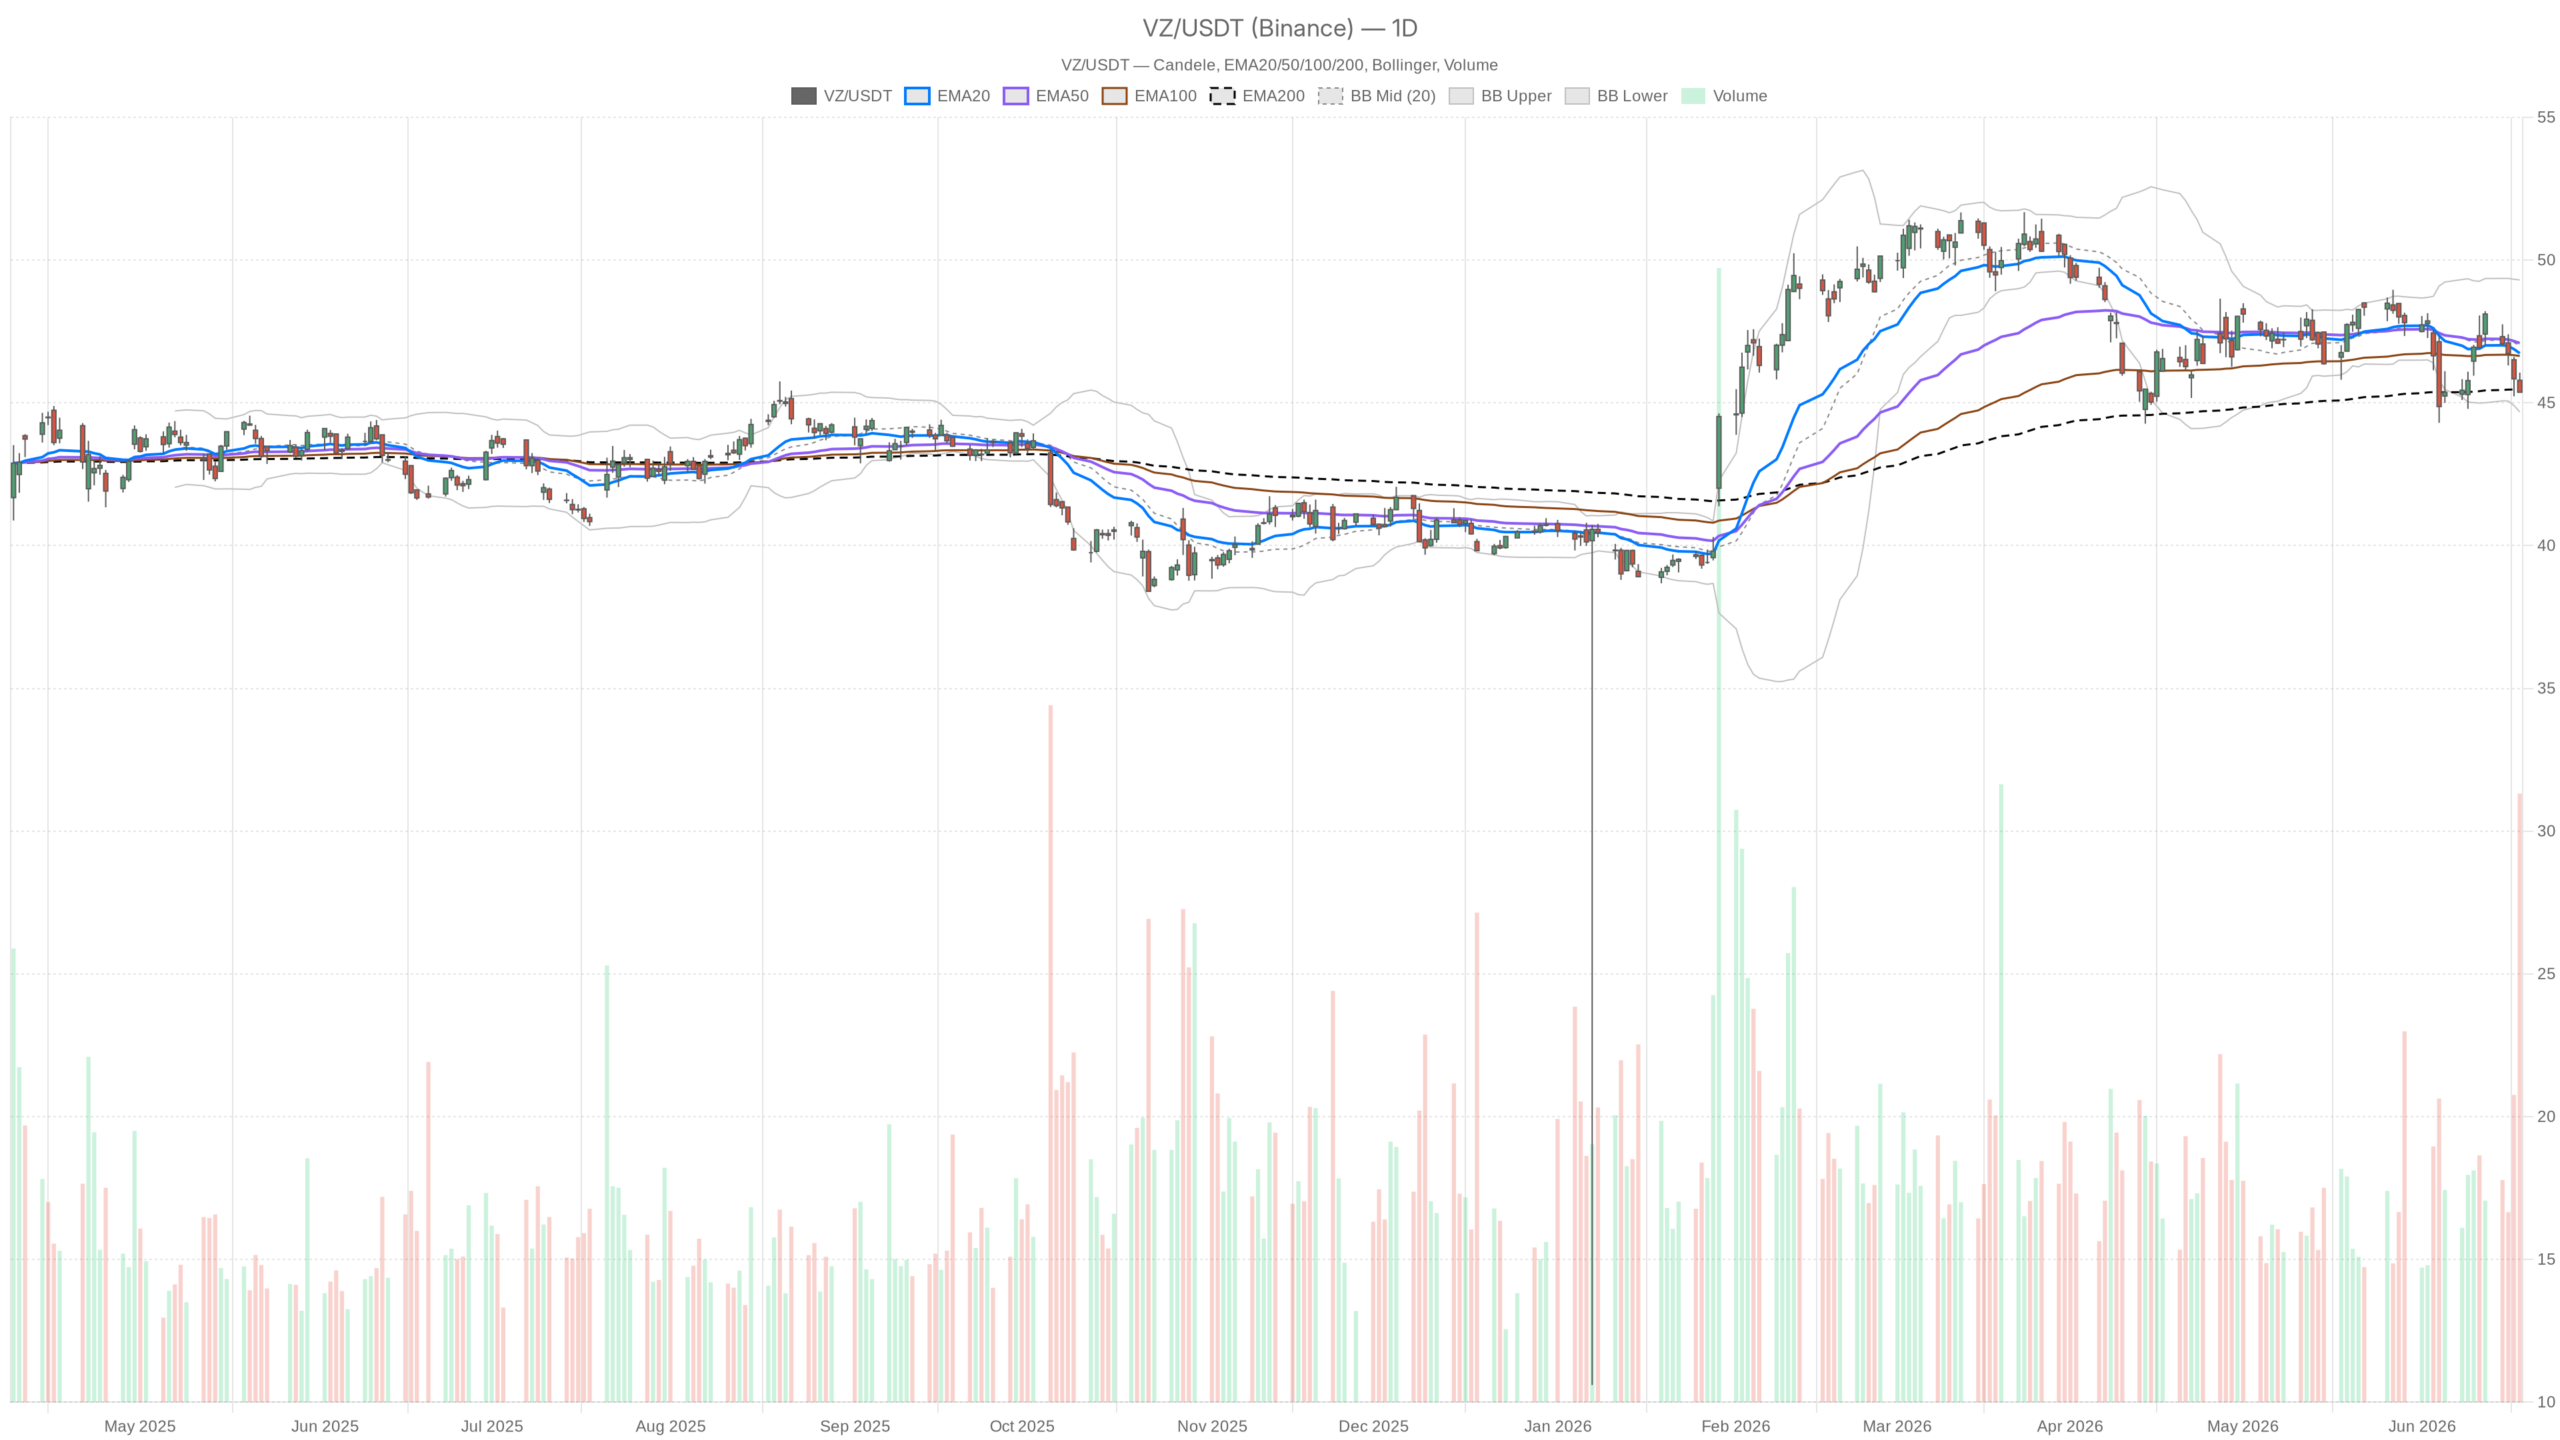 VZ — daily chart with candlesticks, EMA20/EMA50 and volume.
Key takeaways
- VZ closed at $45.37, breaching the 200-day EMA at $45.47.
- Daily RSI sits at 39.76 with MACD firmly in negative territory.
- The hourly EMA stack remains bearish across all three timeframes.
- A 6.06% annual dividend yield anchors the long-term valuation case.
- Near-term path of least resistance points toward S1 at $45.13 and the lower Bollinger band at $44.68.
Daily Technical Structure Confirms Bearish Momentum in Verizon Stock
Verizon stock’s daily chart reveals a bearish alignment that cannot be dismissed. VZ trades beneath both the 20-day EMA at $46.74 and the 50-day EMA at $47.09. The 200-day EMA at $45.47 has also been breached. This configuration leaves no nearby moving average to act as support. Price action alone confirms sellers remain in control of the daily timeframe.
RSI, MACD, and Bollinger Bands All Flash Caution
The daily RSI sits at 39.76 — not yet oversold, but close enough to signal caution. Dip buyers have not stepped in with any conviction at these levels. Meanwhile, the MACD line at -0.34 runs below the signal line at -0.25. The negative histogram of -0.09 confirms momentum remains decisively bearish. Notably, there is no sign of a crossover forming on the daily frame.
Bollinger Bands reinforce this view. The mid-band stands at $46.99, well above current price. The lower band rests near $44.68. VZ is drifting toward the lower half of its range. This positioning typically signals sustained weakness. A reversal would require volume-driven demand that has yet to materialize. The daily ATR of $1.25 indicates moderate but not explosive volatility.
Hourly Chart Amplifies the Bearish Message for Verizon Stock
The hourly timeframe presents an unambiguously bearish regime for Verizon stock. All three EMAs — the 20-hour at $45.97, the 50-hour at $46.40, and the 200-hour at $46.90 — sit above price. This clean bearish alignment across every moving average leaves no room for bullish interpretation. In contrast to the daily neutral tag, the hourly classification flips fully bearish.
Momentum Indicators Signal Persistence, Not Reversal
The hourly RSI at 34.13 presses closer to oversold territory. In a confirmed downtrend, however, a low RSI often signals trend persistence rather than reversal. The hourly MACD line and signal both sit at -0.37. The near-flat histogram of -0.01 may indicate the most aggressive selling is exhausting. Still, without a bullish crossover, it is premature to read this as a recovery setup. Bollinger Bands show price hugging the lower band near $44.94, confirming sustained distribution.
15-Minute Chart and Pivot Levels Define the Short-Term Battlefield
Short-term traders should watch the 15-minute chart for execution timing. Price closed at $45.38 with all three EMAs stacked above. The 15-minute RSI of 38.78 echoes the hourly reading. No immediate reversal momentum is present. The Bollinger Band range has tightened — upper at $45.97, lower at $45.34. This compression often precedes a directional break. Given the broader bearish context, a breakdown carries more weight than a breakout.
Daily pivot analysis sharpens the short-term picture. The pivot sits at $45.60, with R1 at $45.83 and S1 at $45.13. VZ closed below the pivot at $45.37 — a technically bearish posture. A recovery above $45.83 would be the minimum required to shift sentiment. On the downside, S1 at $45.13 serves as the first meaningful support for Verizon stock. Below that, the Bollinger lower band at $44.68 becomes the next reference.
Fundamental Narrative Paints a More Constructive Picture
Despite the bearish technical landscape, Verizon stock’s fundamental story offers some counterbalance. The company recently completed a cash tender offer on 20 series of notes. This capital structure move could reduce interest costs over time. More visibly, Verizon is rolling out a loyalty program, eliminating upgrade fees, and launching competitive retention offers. These moves directly address elevated wireless churn, which the CEO acknowledged on the January earnings call.
The 6.06% annual dividend yield continues to anchor the valuation argument. Some analysts have also flagged the stock as potentially 7.5% undervalued at recent trading levels. However, these fundamental tailwinds have yet to translate into technical strength on the chart.
Bullish and Bearish Scenarios: The Path of Least Resistance
For bulls to regain control, Verizon stock must reclaim the 200-day EMA at $45.47 on a closing basis. It must then push through R1 at $45.83. A sustained move above the 20-day EMA at $46.74 would signal the distribution phase is ending. Positive subscriber data or reaffirmed guidance could serve as catalysts. The loyalty program, if successful in curbing churn, would provide a longer-term tailwind.
The Bearish Path Is Better Supported by Price Structure
The bearish scenario is simpler and currently better supported by price action. Continued failure below the 200-day EMA opens the door to S1 at $45.13. The next downside target sits at the Bollinger lower band near $44.68. A broader market risk-off episode would accelerate that move. Converging bearish signals across the hourly and 15-minute frames suggest intraday rallies will likely be sold into rather than sustained.
Overall Outlook: Technical Caution Prevails Over Valuation Appeal
Overall, Verizon stock presents a cautionary technical picture despite a reasonably compelling valuation case. The daily bias is tilted bearish given the EMA structure and negative momentum. The hourly frame offers no conflicting evidence — it simply amplifies the same message. Traders should respect the compression on the 15-minute chart and wait for a directional break before committing. The dividend yield and undervaluation arguments matter for long-term investors. However, from a price-structure standpoint, the path of least resistance currently points lower until VZ reclaims its key moving averages with conviction.
FAQ
What is the current technical outlook for Verizon stock?
Verizon stock is under bearish pressure, trading below its 20-day, 50-day, and 200-day EMAs. The daily RSI at 39.76 and negative MACD confirm sustained selling momentum with no crossover in sight.
What are the key support levels for VZ right now?
The first support sits at the daily S1 pivot of $45.13. Below that, the Bollinger lower band near $44.68 becomes the next logical reference. The 200-day EMA at $45.47 has already been breached.
Is Verizon stock undervalued despite the bearish technicals?
Some analysts flag VZ as potentially 7.5% undervalued. The 6.06% annual dividend yield provides valuation support. However, these fundamentals have not yet translated into technical strength on the chart.
What would signal a trend reversal for Verizon stock?
A closing recovery above the 200-day EMA at $45.47 would be the first step. A sustained move above the 20-day EMA at $46.74 would confirm the distribution phase is ending. Positive subscriber data could serve as a catalyst.
Disclaimer: This article is for informational purposes only and does not constitute financial advice, an investment recommendation, or a solicitation to buy or sell any financial instrument or cryptocurrency. The analysis provided is not indicative of future results. Investing in crypto assets and financial markets carries a high risk of capital loss. Always do your own research (DYOR) and consult a qualified financial advisor before making any decision.
Article produced with the assistance of artificial intelligence and reviewed by the editorial team.


 English (US) ·