
 5 hours ago
26
5 hours ago
26

Iren Stock faces a rare tension: fundamentally compelling, technically broken. IREN secured US$2.8 billion in AI cloud contracts with Microsoft and NVIDIA — yet the shares closed flat at $40.58 on July 23. An intraday spike to $43.43 was fully rejected. That price action tells its own story.
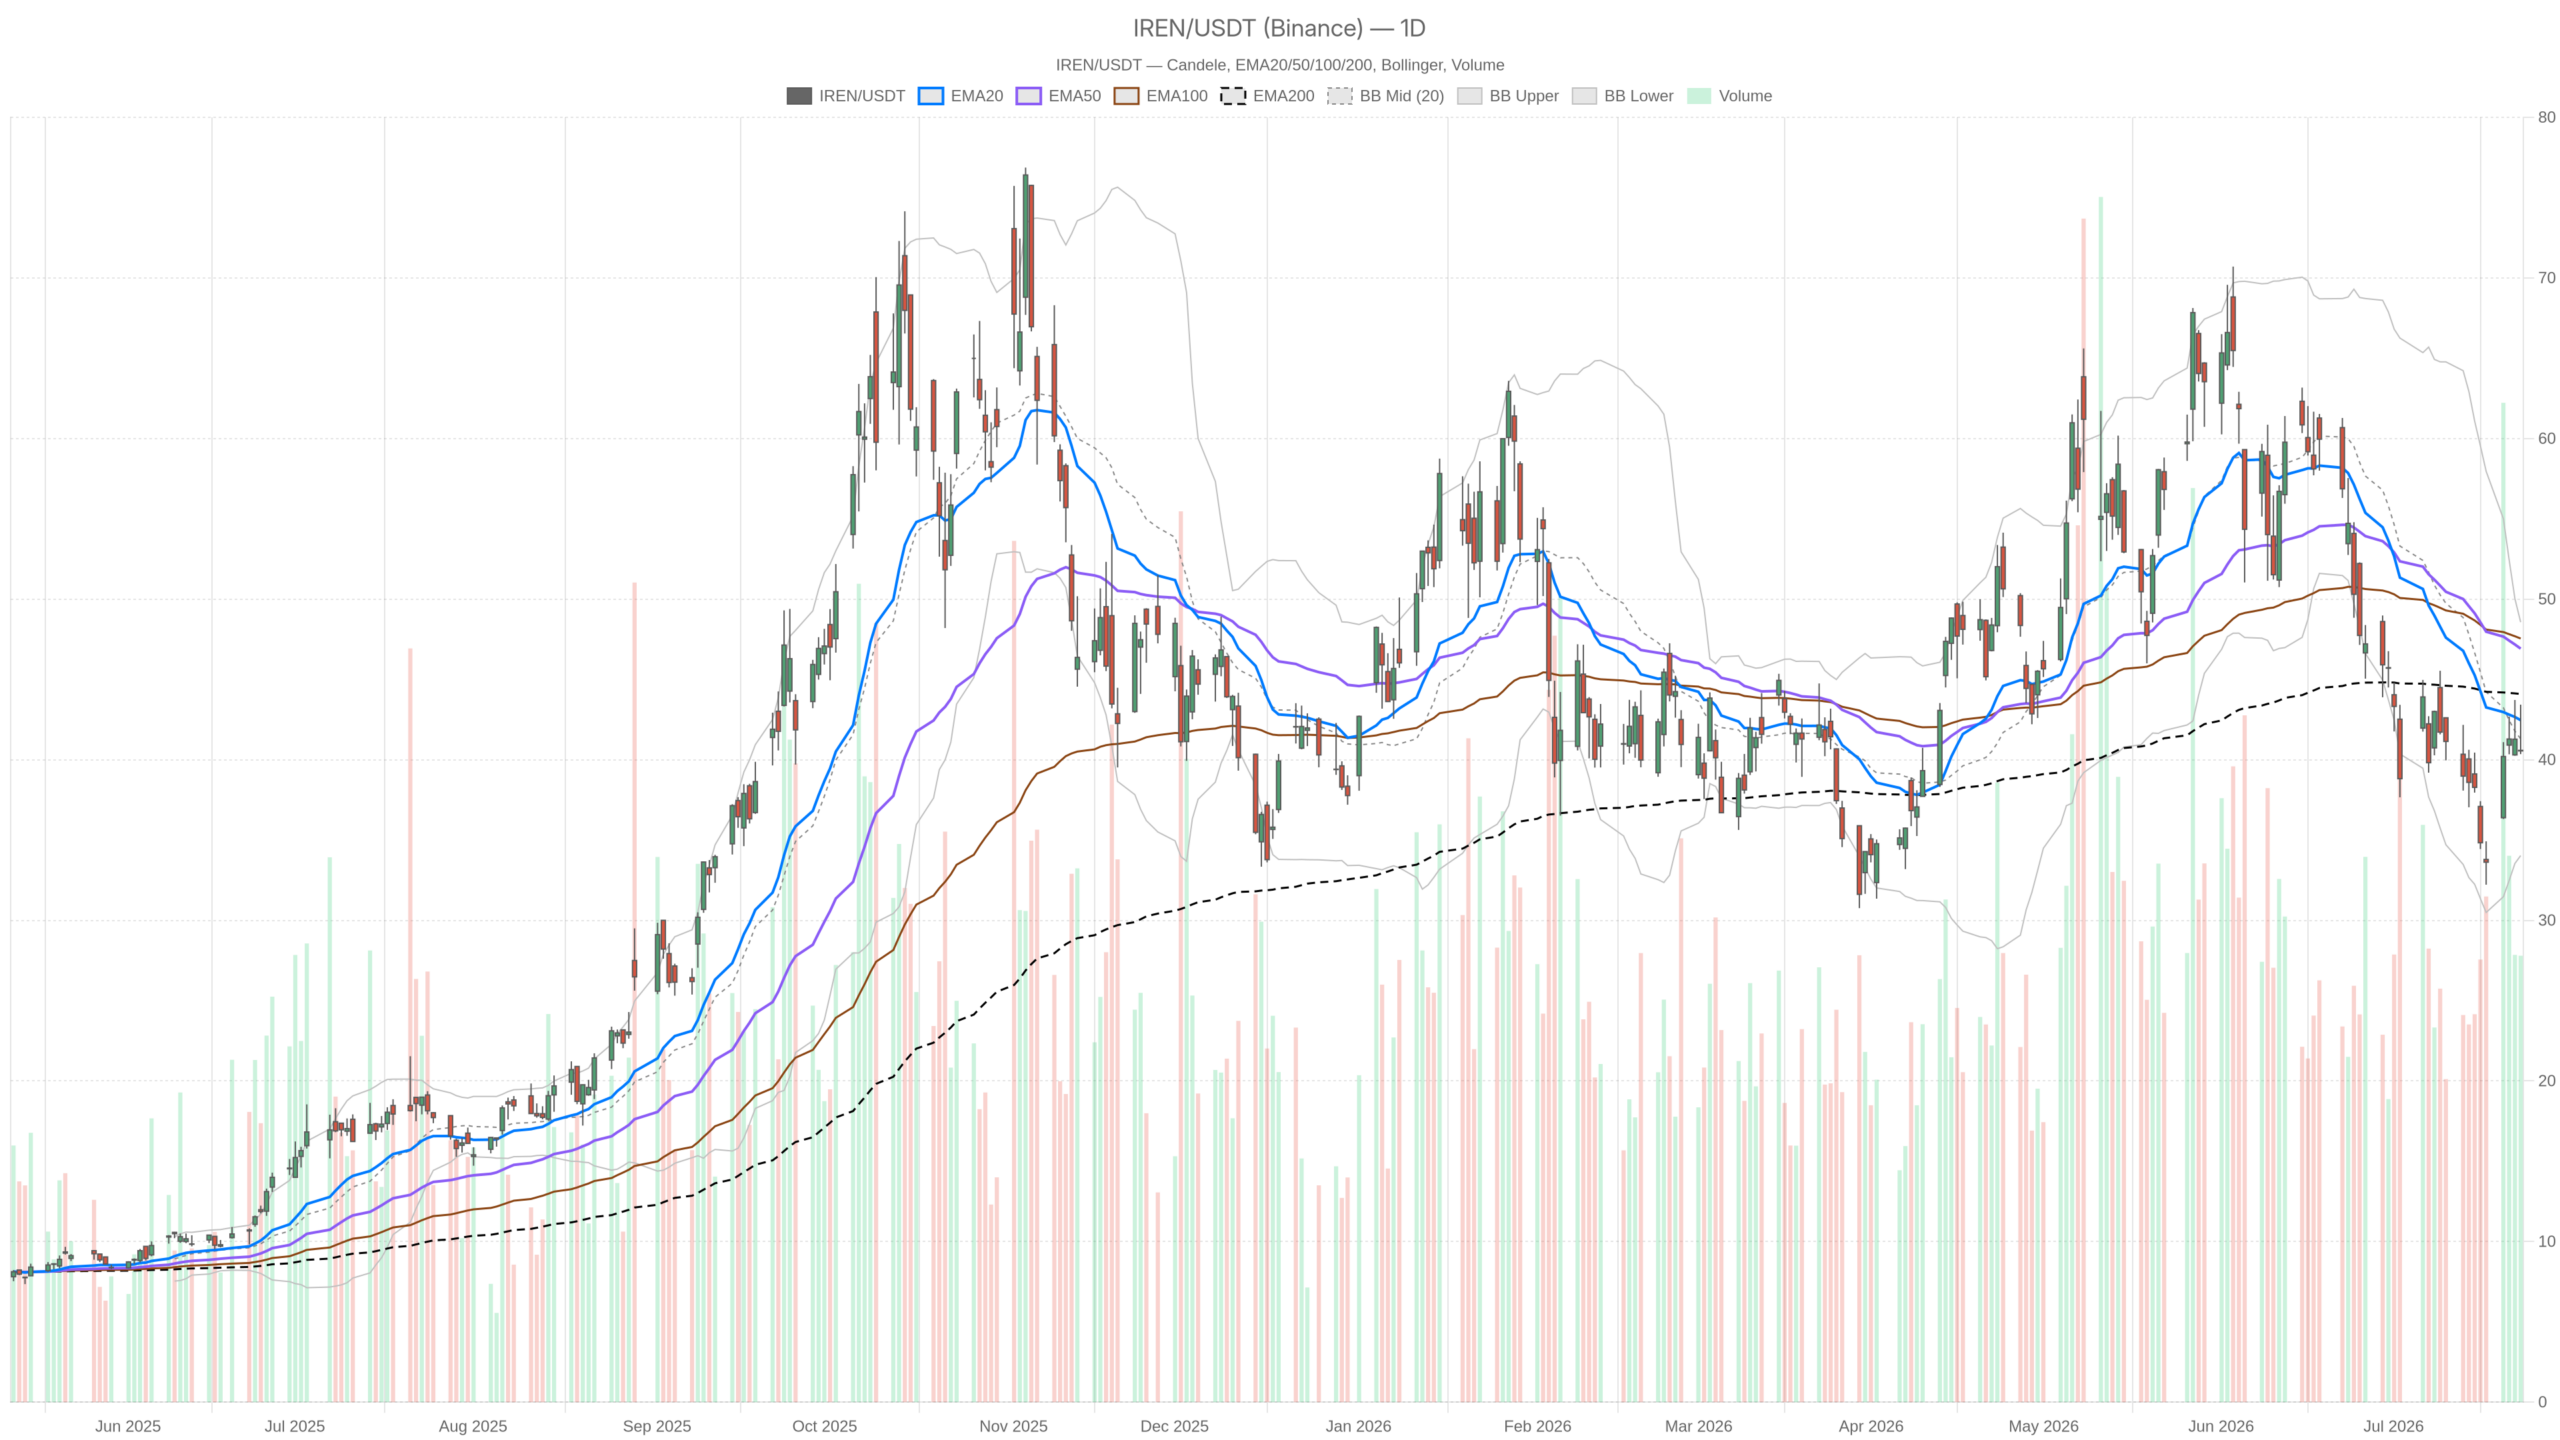 IREN — daily chart with candlesticks, EMA20/EMA50 and volume.
Key takeaways
- IREN closed at $40.58 on July 23 despite announcing US$2.8 billion in new multi-year AI cloud contracts
- Iren Stock trades below all three major daily moving averages, confirming a structurally bearish trend
- The daily RSI at 43.88 remains below neutral, with no oversold exhaustion signal in sight
- Daily support sits at $39.48; a break lower exposes the lower Bollinger Band at $34.03
- A sustained close above $42.50–$43.00 is required to shift the technical bias toward recovery
Daily Bias: Iren Stock Remains Under Bearish Pressure
The daily chart for Iren Stock is unambiguously bearish. Price sits below all three major moving averages, confirming a structurally negative trend.
Iren Stock trades at $40.58, well below its EMA20 at $42.46. It also sits beneath the EMA50 at $46.92 and — critically — below the EMA200 at $44.10. When price stays under all three major moving averages simultaneously, the structural trend is unambiguously negative.
The daily RSI at 43.88 sits below the neutral 50 threshold. It is not deeply oversold. This means there is no clear exhaustion signal yet. Momentum has simply been grinding lower without reaching a washout level that typically precedes sharp reversals.
Momentum Deceleration Offers a Tentative Signal
Meanwhile, the daily MACD tells a nuanced story. The MACD line stands at -3.47, still well in negative territory. However, the histogram has moved to +0.54. This modest positive reading indicates bearish momentum is losing intensity. It is not a bullish crossover — just a hint that selling pressure may be decelerating.
Daily Bollinger Bands show the midline at $41.30, with the upper band at $48.57. The lower band sits at $34.03. Iren Stock trades below the midline, reinforcing the soft bias. The ATR14 at $3.85 confirms this remains a high-volatility name. A single session can easily cover $4 in range, as the July 23 candle demonstrated with a $3.08 spread from low to high.
Daily pivot analysis places support at $39.48 and resistance at $42.56. The close at $40.58 sits near the pivot point of $41.45. This is a structurally indecisive position. The daily regime is flagged as neutral, reflecting the unresolved battle between a bearish trend and tentative stabilization signals.
Hourly Structure: Neutral with Subtle Weakness
The hourly chart for Iren Stock does not materially improve the bullish case. The 1H timeframe remains neutral, with neither buyers nor sellers establishing clear control.
Price at $40.59 sits just above the 1H EMA20 at $41.00 — barely. The 1H EMA50 at $40.24 provides near-term support just below current levels. In contrast, the 1H EMA200 at $45.00 looms far above, acting as a significant overhead obstacle. This layered resistance structure limits upside potential.
The hourly RSI at 49.31 is almost exactly neutral. No clear directional momentum exists on this timeframe. Buyers and sellers are effectively in a standoff.
However, the 1H MACD complicates the picture. The histogram prints at -0.30. The MACD line at 0.47 sits below the signal line at 0.77. This downside crossover on the hourly chart weakens the short-term recovery narrative that the daily MACD histogram had begun to construct.
Meanwhile, 1H Bollinger Bands show price approaching the lower band at $40.15. This proximity can signal near-term compression or a potential bounce zone. Still, it requires confirmation. The 1H ATR at $1.28 implies moderate intraday volatility — manageable, but not negligible given the structural uncertainty.
Overall, the hourly frame fails to confirm a bullish reversal. It slightly weakens the daily bearish momentum but provides no upside confirmation to shift the bias.
15-Minute Context: Execution Caution Is Warranted
The 15-minute chart reinforces the need for execution discipline. Short-term signals offer no directional conviction for Iren Stock.
The 15m EMA20 at $41.00 and EMA50 at $41.22 both act as near-term resistance above the $40.59 close. The 15m MACD histogram sits at -0.01 — essentially flat. This signals no short-term directional conviction whatsoever. The 15m RSI at 42.26 points mildly lower.
Notably, the 15m EMA200 at $40.08 is the only moving average currently providing support below the price. The 15m pivot point of $40.60 aligns almost exactly with the close. This confirms a position at a critical inflection point where the next move — in either direction — carries meaningful implications.
The Fundamental Catalyst: Real, but Not Yet Enough
The fundamental news for Iren Stock is genuinely significant. The market’s reaction, however, raises caution.
IREN secured US$2.8 billion in new multi-year AI cloud contracts. These deals push the 2026 AI Cloud ARR target above US$4 billion. The client roster — Microsoft and NVIDIA — lends credibility to the strategic transformation. IREN is pivoting from a Bitcoin mining operation into a vertically integrated AI cloud provider.
Yet the market’s reaction on July 23 tells a cautionary tale. The stock spiked to $43.43 intraday and closed at $40.58. That $2.85 rejection from the highs in a single session shows sellers are actively using positive news as an exit opportunity. At least one major analyst has rated Iren Stock a Sell, citing risks including dilution and higher capital costs. Whether IREN is undervalued following these contracts remains openly debated.
Bullish Scenario: Reclaiming $42.50–$43.00 Is the Line in the Sand
A credible bullish case for Iren Stock exists — but it requires specific technical confirmation.
The daily MACD histogram turning positive is a first step, already in place. For that signal to matter, price needs to reclaim the daily EMA20 at $42.46 on a closing basis. Above that level, the Bollinger midband at $41.30 would become support rather than resistance. The daily R1 pivot at $42.56 would then be the first meaningful test.
Therefore, a sustained break above $42.50–$43.00, accompanied by improving RSI momentum through the 50 level, would shift the technical bias toward recovery. The fundamental story — US$2.8 billion in AI contracts with marquee partners — would then act as genuine fuel rather than a faded catalyst.
Bearish Scenario: Failure at $39.48 Exposes Deeper Downside
Conversely, Iren Stock faces significant downside risk if support breaks. The technical structure leaves little room for complacency.
Failure to hold above daily support at $39.48 would be a significant warning. A break below that level would put the lower Bollinger Band at $34.03 back in play. That represents a drop of roughly 16% from current levels. The EMA50 at $46.92 and EMA200 at $44.10 remain distant overhead resistance. Any sustained rally faces multiple technical barriers before it could be called a trend reversal.
Notably, the July 23 session itself reinforces the bearish case. News of the magnitude of a US$2.8 billion contract win failing to hold a $3 gain is a classic distribution signal. Institutional sellers absorbed demand rather than chasing momentum higher.
Positioning and the Path Forward for Iren Stock
Iren Stock sits at a crossroads where fundamental momentum and technical structure pull in opposite directions. The path forward demands disciplined positioning.
The daily ATR of $3.85 demands respect. This is not a low-volatility, slow-moving name. Positions sized without accounting for that range will be shaken out easily. The neutral regime flags across all three timeframes reflect genuine uncertainty, not complacency.
Until IREN can reclaim the $42.46–$43.00 zone on a closing basis, the technical bias remains cautiously bearish despite the compelling contract news. The fundamental story may eventually win — but the chart is not yet confirming it.
FAQ
Is Iren Stock a buy after the $2.8 billion AI contract announcement?
The technical picture remains bearish despite the positive news. IREN trades below all three major daily moving averages, and the July 23 session saw a full rejection from intraday highs. A sustained close above $42.50–$43.00 would be required before the technical bias shifts toward recovery.
What are the key support and resistance levels for Iren Stock?
Daily support sits at $39.48, with the lower Bollinger Band at $34.03 representing the next major downside target. Resistance stands at $42.56 (daily R1 pivot) and the EMA20 at $42.46. Above that, the EMA200 at $44.10 and EMA50 at $46.92 form additional overhead barriers.
What would make Iren Stock turn bullish?
Price would need to reclaim the daily EMA20 at $42.46 on a closing basis, break above the $42.50–$43.00 zone, and see the RSI push through the neutral 50 level with improving momentum. The daily MACD histogram already turning positive is an early step, but it requires price confirmation to become actionable.
Why did Iren Stock not rally on the contract news?
The July 23 session revealed a classic distribution pattern. The stock spiked to $43.43 intraday but closed at $40.58, with sellers absorbing the demand triggered by the announcement. This suggests institutional investors used the positive news flow as a liquidity event to reduce positions rather than chase the stock higher.
Disclaimer: This article is for informational purposes only and does not constitute financial advice, an investment recommendation, or a solicitation to buy or sell any financial instrument or cryptocurrency. The analysis provided is not indicative of future results. Investing in crypto assets and financial markets carries a high risk of capital loss. Always do your own research (DYOR) and consult a qualified financial advisor before making any decision.
Article produced with the assistance of artificial intelligence and reviewed by the editorial team.








 English (US) ·