
 1 hour ago
10
1 hour ago
10
Key Takeaways
- XRP currently sits at $1.12, reflecting a 3.11% decline in the last 24 hours and an 8.91% drop across the previous seven days
- Technical analyst Egrag Crypto identifies a falling wedge formation, noting that a validated breakout requires reclaiming the $1.66–$2.00 zone before extended targets become relevant
- Market analyst Diana suggests that a decisive push beyond $1.30 accompanied by robust trading volume would signal bullish momentum toward $1.65
- Ali Charts highlighted that the Tom DeMark Sequential technical tool has generated a buy indication for XRP, hinting at a possible price recovery
- Critical bearish levels include $1.09, $0.90, and $0.86 should current support zones fail to hold
XRP finds itself defending a pivotal support threshold at $1.12, with market observers divided over whether purchasing pressure can maintain this level or if additional declines lie ahead.
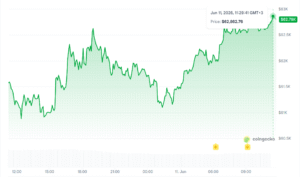
At press time, XRP is changing hands at $1.12, marking a 3.11% decrease over the preceding 24-hour period. Trading volume has similarly contracted by 5.04%, registering $1.84 billion in activity. The token has experienced an 8.91% pullback throughout the past week, per CoinMarketCap data.
The decline commenced after the asset failed to sustain momentum above the $1.1550 level. Subsequently, it pierced through $1.1420 and violated the 50% Fibonacci retracement calculated from the $1.050 swing low to the $1.1862 peak. XRP now trades beneath its 100-hour Simple Moving Average.
Chart analysis reveals a bearish trendline on the hourly timeframe, with immediate resistance positioned at $1.120. This represents the initial obstacle that bullish traders must overcome.
Resistance Zones That Could Halt Upward Movement
Should XRP generate upward momentum, the initial significant resistance emerges at $1.1350. Successfully clearing this barrier might pave the way toward $1.1420, followed by $1.1550. Subsequent resistance targets beyond these points include $1.1650 and $1.1840.
Technical analyst Diana maintains close observation of the $1.25 area. Her assessment indicates XRP has bounced from macro support near $1.09 and is presently challenging the $1.20–$1.25 resistance band. She emphasizes that XRP must maintain positioning above $1.12 and breach $1.25–$1.30 with substantial volume to validate bullish continuation.
 XRP APPROACHING $1.25 DECISION ZONE — BREAKOUT TO $1.65 OR FINAL DROP TO $0.90?

After bouncing from the $1.09 macro support, $XRP is now attempting to build momentum toward the $1.20-$1.25 resistance area. 
 BULLISH:
If $XRP HOLDS above $1.12 and breaks through… https://t.co/HIjS19q6Ie pic.twitter.com/MphgsGhVnS
— Diana (@InvestWithD) June 9, 2026
According to Diana’s framework, a successful move above $1.30 would establish a price objective near $1.65. Such a development would provide relief from the ongoing corrective phase.
Market analyst Ali Charts shared on X that the Tom DeMark Sequential technical indicator has triggered a buy signal for XRP, suggesting the possibility of upward price action from present levels.
The Tom DeMark Sequential indicator has flashed a buy signal on $XRP, anticipating a potential rebound. pic.twitter.com/ZABEIx1VIW
— Ali Charts (@alicharts) June 10, 2026
Technical strategist Egrag Crypto presented a comprehensive macro analysis incorporating Fibonacci circles, channels, extensions, and a falling wedge pattern. His evaluation indicates XRP is consolidating within a significant Fibonacci timing window.
#XRP – Macro Confluence Is Building  :
:
This chart is not about one single tool. It is about confluence.
We have multiple TA frameworks pointing toward the same macro decision zone: Fib Circles = timing + price rhythmFib Channels = expansion pathFib Extensions = target… pic.twitter.com/DhfwuMzgHZ
— EGRAG CRYPTO (@egragcrypto) June 10, 2026
Downside Scenarios If Current Levels Fail
Egrag’s analysis emphasizes that a validated wedge breakout must first recapture the $1.66–$2.00 range. Following such confirmation, his projected upside objectives include $8.48, $13.70, $18.06, and $27.68 based on various Fibonacci extension calculations. These projections remain contingent upon proper technical confirmation.
In a scenario where the pattern fails to materialize, Egrag identifies $1.21, $0.90, and $0.60 as downside support targets.
From a bearish perspective, if XRP cannot defend the $1.10 threshold, the subsequent major support zone appears near $1.080 — corresponding to the 76.4% Fibonacci retracement level. A violation below $1.080 would expose $1.0650, then $1.050. Further downside would bring $1.020 and $1.00 into consideration.
Failure to overcome resistance near $1.25 may extend the current corrective phase, with a breakdown below $1.09 potentially activating targets in the $0.90–$0.86 region.
The critical levels for XRP remain $1.09, $1.25, and $1.30. Currently, the price maintains a position marginally above $1.10 support while the hourly trendline continues to restrict rallies at $1.120.
The post XRP Price Analysis: Can This Digital Asset Hold $1.12 Support Amid Market Turbulence? appeared first on Blockonomi.


 English (US) ·