
 4 hours ago
18
4 hours ago
18

Airbnb, Inc. stock surged 11% after-hours on 6 August following a Q2 beat and upgraded 2026 guidance. ABNB closed at $151.64 before earnings. The daily uptrend remains intact. However, the gap now pushes price beyond every near-term reference level, reshaping the risk profile without changing the direction.
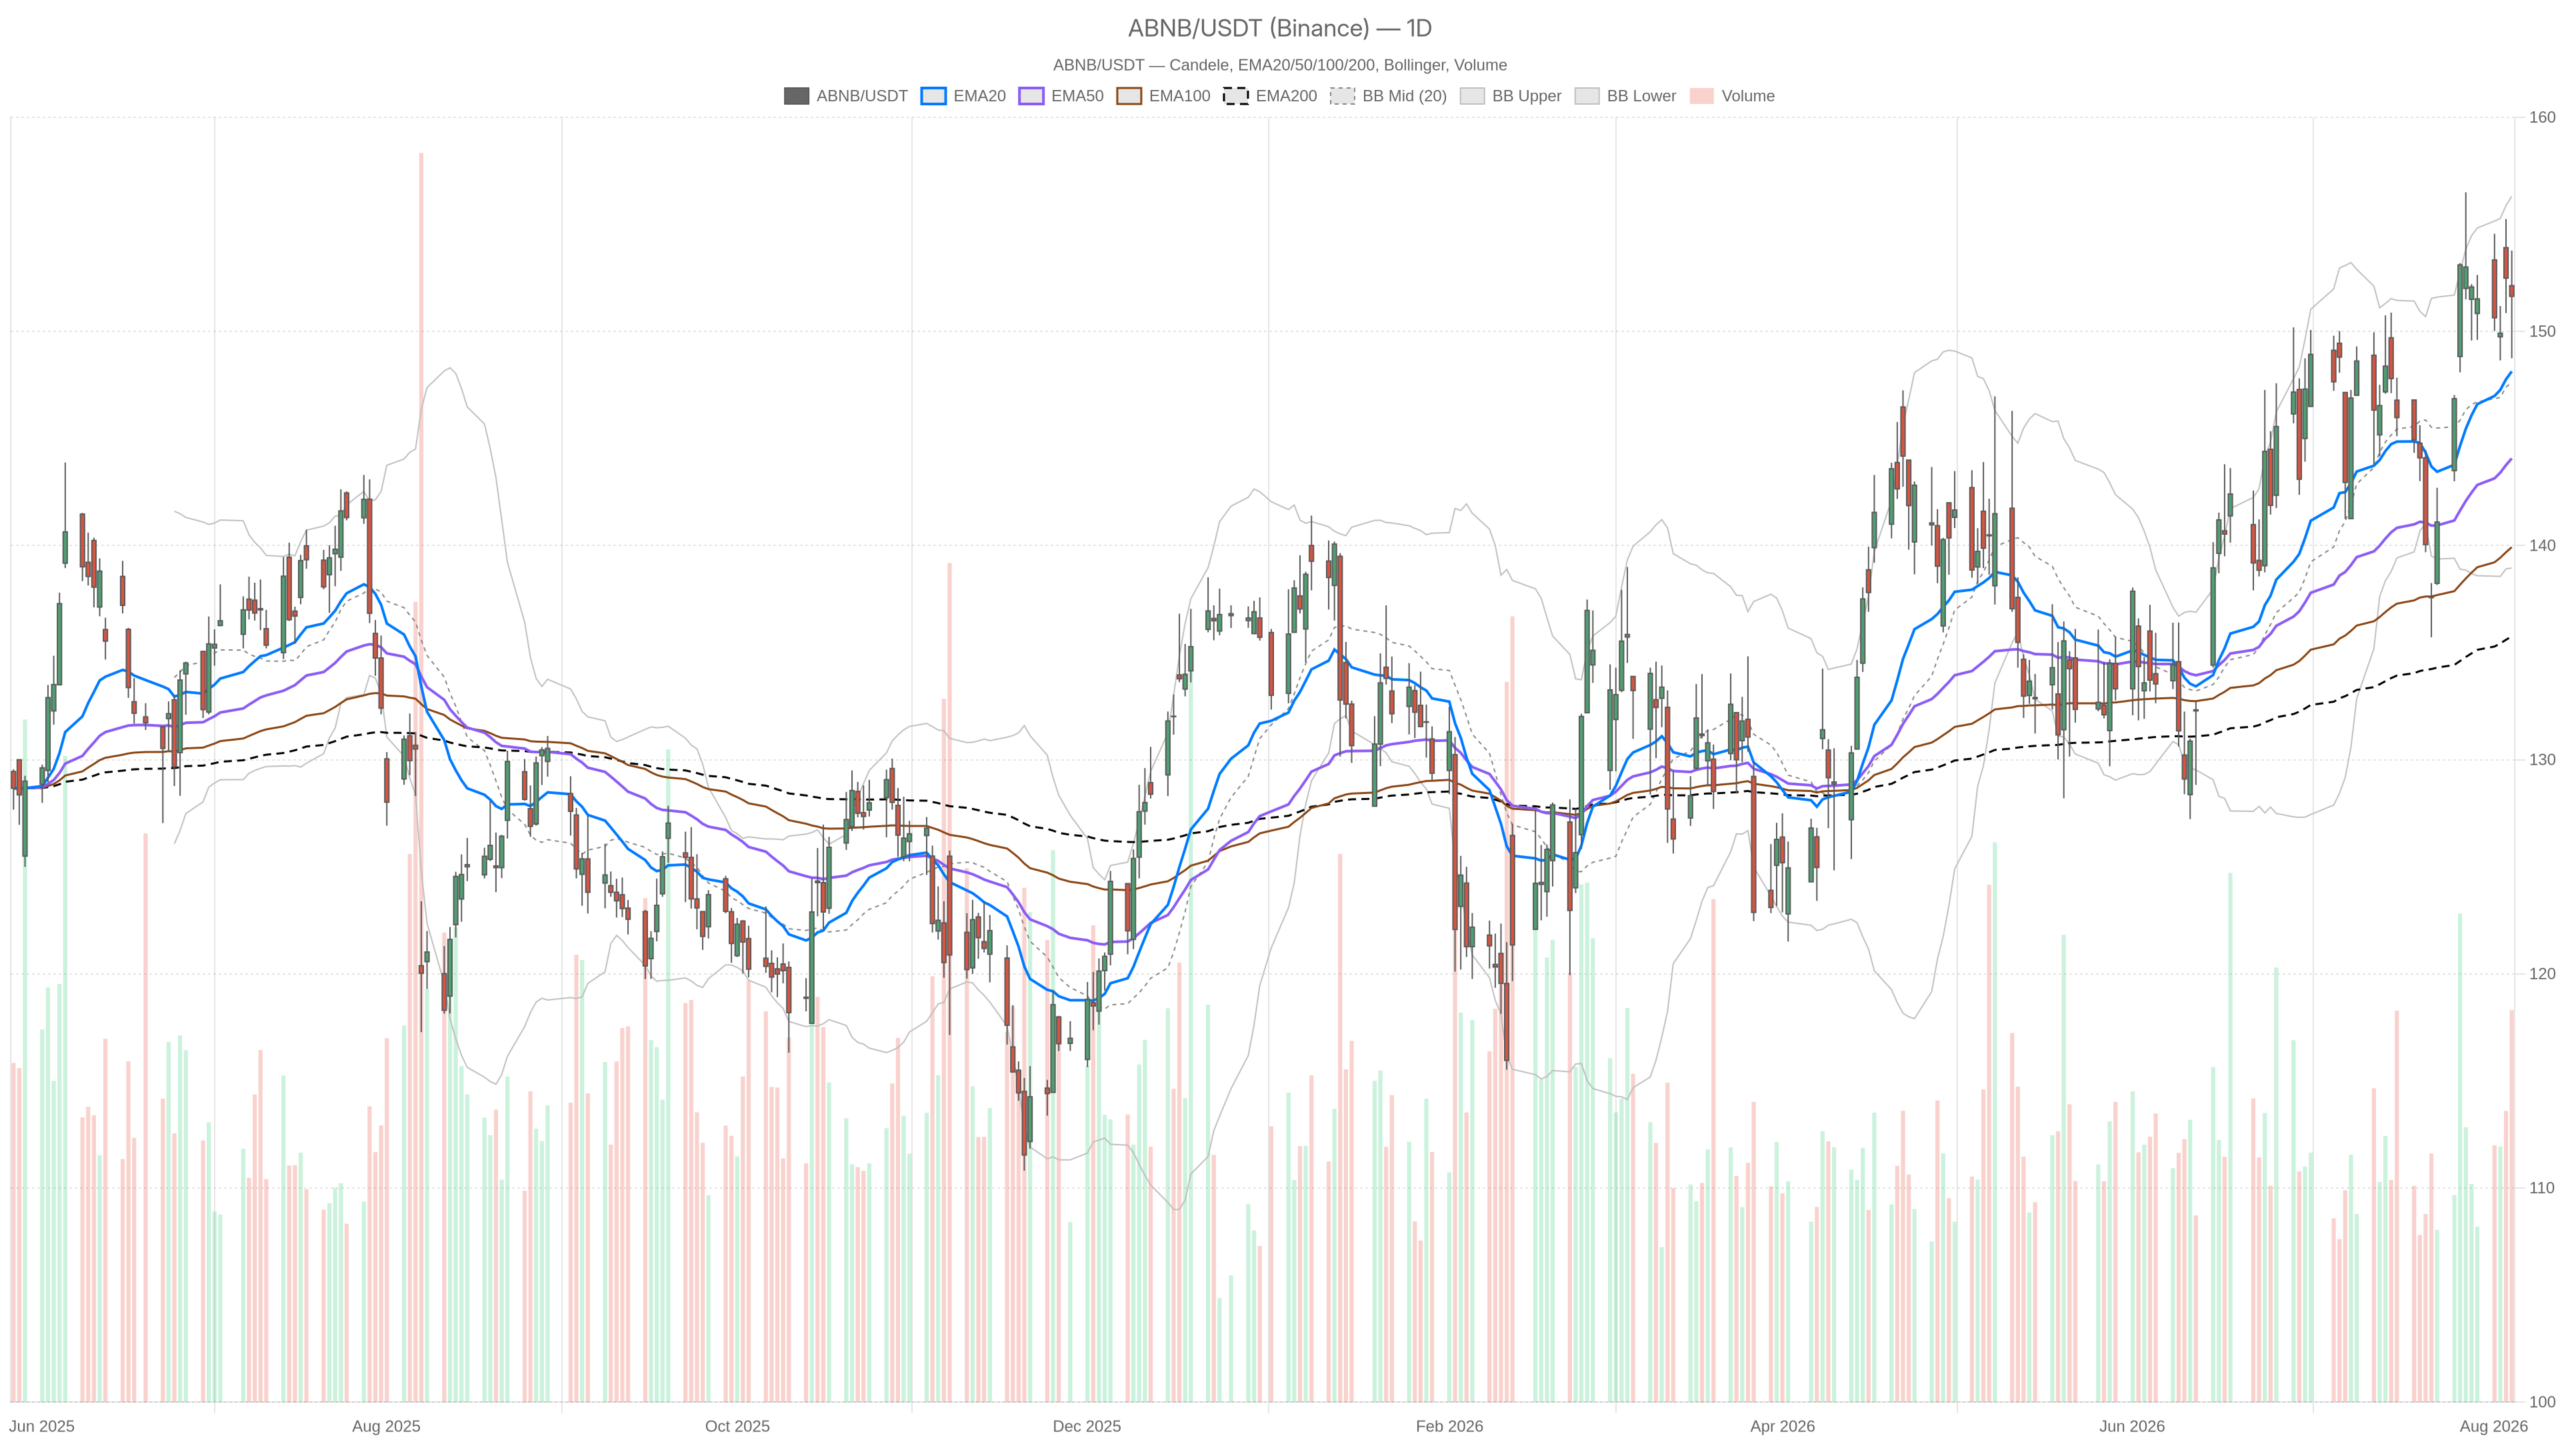 ABNB — daily chart with candlesticks, EMA20/EMA50 and volume.
Key takeaways
- Airbnb, Inc. stock surged 11% after-hours after reporting Q2 income of $816 million and raising its full-year 2026 outlook.
- The daily trend structure remains bullish, with price above EMA20 at 148.14, EMA50 at 144.07, and EMA200 at 135.76.
- Daily RSI at 58.56 leaves room for further upside before overbought conditions emerge.
- The post-earnings gap clears the daily upper Bollinger band at $156.31, creating thin and untested price structure above.
- Key support sits at the hourly EMA50 at 150.23; a break below daily EMA20 at 148.14 would put the bullish case in doubt.
Daily structure defines a clean bullish bias for Airbnb, Inc. stock
The daily chart leaves little room for bearish interpretation. Price trades above a properly ordered moving average stack, and momentum was still expanding into the earnings print.
The moving average stack on the daily chart is textbook constructive. EMA20 sits at 148.14, EMA50 at 144.07, and EMA200 at 135.76. Price trades above all three, and the sequence is properly ordered. That is the signature of a trend that has been building for some time, not a reflex bounce.
Momentum agrees, but without excess. Daily RSI reads 58.56, firmly in bullish territory yet well short of overbought. MACD confirms the same picture. The line sits at 2.43 above its 2.11 signal, and the histogram is positive at 0.32. It was expanding slowly into the print rather than fading, which matters when a catalyst arrives.
Bollinger Bands and volatility signal regime expansion
Bollinger Bands frame the levels that now come under pressure. The daily mid-band sits at 147.63, with the upper band at 156.31 and the lower at 138.95. Price was already trading above the mid-band and drifting toward the upper edge before earnings. An 11% gap would clear that upper band decisively, and also leave daily pivot resistance at 154.03 far behind.
Meanwhile, volatility is the part traders should respect most. Daily ATR stands at 4.32, meaning a typical session covers roughly three dollars less than the implied post-earnings move. In other words, the market is pricing a jump of several average daily ranges in one step. Gaps of that size tend to create thin, untested price structure above.
The hourly chart confirms the trend but shows pre-earnings hesitation
The hourly chart supports the bullish bias but reveals the pre-earnings hesitation typical before major catalysts. Short-term averages have compressed, and momentum has flattened, reflecting a market waiting for direction.
On the 1H timeframe the regime remains bullish, yet the details are more cautious. Price closed at 151.70, just above EMA20 at 150.82 and EMA50 at 150.23. EMA200 sits lower at 146.62. The stack is still supportive. However, the short-term averages are compressed within about half a dollar of each other.
That compression is the tell. Hourly RSI at 54.95 is barely above neutral. MACD has flattened completely. The line sits at 0.00, slightly below its 0.05 signal, with a marginally negative histogram of -0.05. This is not weakness in the trend. It is the classic pre-event drift, where directional conviction disappears while participants wait for numbers.
Hourly Bollinger Bands reinforce that reading. The mid-band at 150.69 sits almost exactly where price closed, with the upper band at 153.23 and the lower at 148.14. At the same time, hourly ATR of 1.66 describes a market moving in controlled increments. The post-earnings reaction breaks that rhythm entirely. This is why hourly signals generated before the release now carry limited weight.
Fifteen-minute context: buyers were already leaning in
The 15-minute chart shows buyers were already leaning in ahead of the release. Late-session price action pushed above intraday resistance with recovering momentum, though the overall regime remained neutral.
The 15m chart is flagged neutral, and the internals explain why. EMA20 at 150.55 sits slightly below EMA50 at 150.76, with EMA200 at 149.94 — a tangled configuration typical of range conditions. However, the final candles show intent. Price closed at 151.70, above the upper 15m Bollinger band at 151.31, with RSI at 60.64.
MACD on this timeframe is also turning. The line at -0.04 remains marginally negative, but it now sits above the -0.24 signal, producing a positive histogram of 0.21. Short-term momentum was recovering into the close. Combined with 15m ATR of just 0.71, the late push above intraday pivot resistance at 152.13 becomes more meaningful in relative terms.
The fundamental backdrop behind the move
The fundamental backdrop directly supports the post-earnings surge. Airbnb delivered a clean Q2 beat with upgraded guidance that contradicted the broader travel slowdown narrative.
Overall, the earnings detail justifies the reaction. Airbnb reported Q2 income of $816 million, with revenue growth of 17% and strength in LATAM and APAC demand. Guidance for Q3 came in upbeat. The company also raised its full-year outlook, citing strong travel demand, accelerating bookings and higher average daily rates. Coverage pointed to contributions from AI initiatives and a World Cup boost.
Notably, the results arrived against a widely discussed travel slowdown narrative, which the numbers did not validate. One counterweight deserves mention: the CFO sold nearly 4,000 shares worth about $575,000. This was disclosed alongside an 18% return in the stock over the past twelve months. Insider sales are rarely decisive on their own. Still, they add a note of caution to an otherwise clean beat.
Bullish scenario
The bullish scenario depends on the gap holding and consolidating above key resistance. Acceptance above the daily upper Bollinger band at 156.31 would confirm a genuine trend extension.
The constructive path requires the gap to hold. Acceptance above the daily upper Bollinger band at 156.31, followed by consolidation rather than immediate rejection, would confirm a genuine trend extension. Daily RSI at 58.56 leaves room before overbought conditions. Therefore, momentum is not the constraint here.
Beyond that, the hourly moving average cluster around 150.23–150.82 becomes the reference support to defend on any pullback. As long as that zone holds, the daily EMA20 at 148.14 remains untested and the structure stays intact. A rising MACD histogram on the daily chart would then reinforce the case that buyers are still adding rather than distributing.
Bearish scenario
The bearish scenario is mechanical rather than fundamental. A sharp fade back inside the daily upper band would signal that the initial reaction was overextended, with profit-taking as the primary driver.
Still, the bearish risk here is mechanical rather than narrative. Post-earnings gaps frequently attract profit-taking, particularly after a 12-month return of 18%. A sharp fade back inside the daily upper band, then below daily pivot resistance at 154.03, would signal that the initial reaction was overextended.
The bullish case weakens materially if price loses the hourly EMA50 at 150.23 and the daily pivot at 151.39. Below that, daily support at 149.00 and the hourly lower band at 148.14 come into focus. A break beneath the daily EMA20 at 148.14 would be the more serious warning. It would put the entire post-catalyst advance in doubt. On the other hand, none of that has happened yet, and the pre-earnings trend was pointing the other way.
Positioning and uncertainty
The honest assessment is a bullish daily bias complicated by execution risk. The gap forces the market to rebuild reference levels from scratch, with ATR readings understating the true volatility now in play.
The honest summary is a bullish daily bias, confirmed by trend structure, but complicated by execution risk. Hourly momentum had gone flat before the release, and the 15m regime remains neutral. Those signals are now largely superseded by the gap. The market must therefore rebuild reference levels from scratch.
Overall, ATR readings of 4.32 daily and 1.66 hourly understate the volatility that a double-digit gap introduces. Wider ranges, thinner liquidity at new highs and unreliable intraday levels are the practical consequences. The trend in Airbnb, Inc. stock still points higher. The uncertainty lies in how much of the reaction survives the first full session of two-way trading.
FAQ
What happened to Airbnb, Inc. stock after Q2 earnings?
Airbnb, Inc. stock surged 11% in after-hours trading on 6 August after the company reported Q2 income of $816 million, revenue growth of 17%, and raised its full-year 2026 outlook. The results contradicted a widely discussed travel slowdown narrative.
Is Airbnb, Inc. stock still in a bullish trend?
Yes. The daily chart shows a textbook bullish structure, with price above EMA20 at 148.14, EMA50 at 144.07, and EMA200 at 135.76. Daily RSI at 58.56 confirms momentum is expanding without being overbought, and MACD remains above its signal line with a positive histogram.
What are the key support levels for ABNB after the gap?
The immediate support zone is the hourly moving average cluster between 150.23 and 150.82. Below that, daily pivot at 151.39 and daily support at 149.00 come into focus. A break beneath daily EMA20 at 148.14 would be the most serious warning, putting the post-catalyst advance in doubt.
What is the main risk for Airbnb, Inc. stock after this earnings gap?
The main risk is mechanical rather than fundamental. Post-earnings gaps of this magnitude frequently attract profit-taking, particularly after an 18% twelve-month return. A sharp fade back inside the daily upper Bollinger band at 156.31 would signal the initial move was overextended.
Disclaimer: This article is for informational purposes only and does not constitute financial advice, an investment recommendation, or a solicitation to buy or sell any financial instrument or cryptocurrency. The analysis provided is not indicative of future results. Investing in crypto assets and financial markets carries a high risk of capital loss. Always do your own research (DYOR) and consult a qualified financial advisor before making any decision.
Article produced with the assistance of artificial intelligence and reviewed by the editorial team.








 English (US) ·