
 1 month ago
42
1 month ago
42

Alphabet Stock remains in a strong daily uptrend, though Monday’s close slipped under a key pivot. Near-term momentum cooled into support, pointing to consolidation rather than a straight continuation. The primary bias stays higher, yet the next leg likely waits for intraday repair.
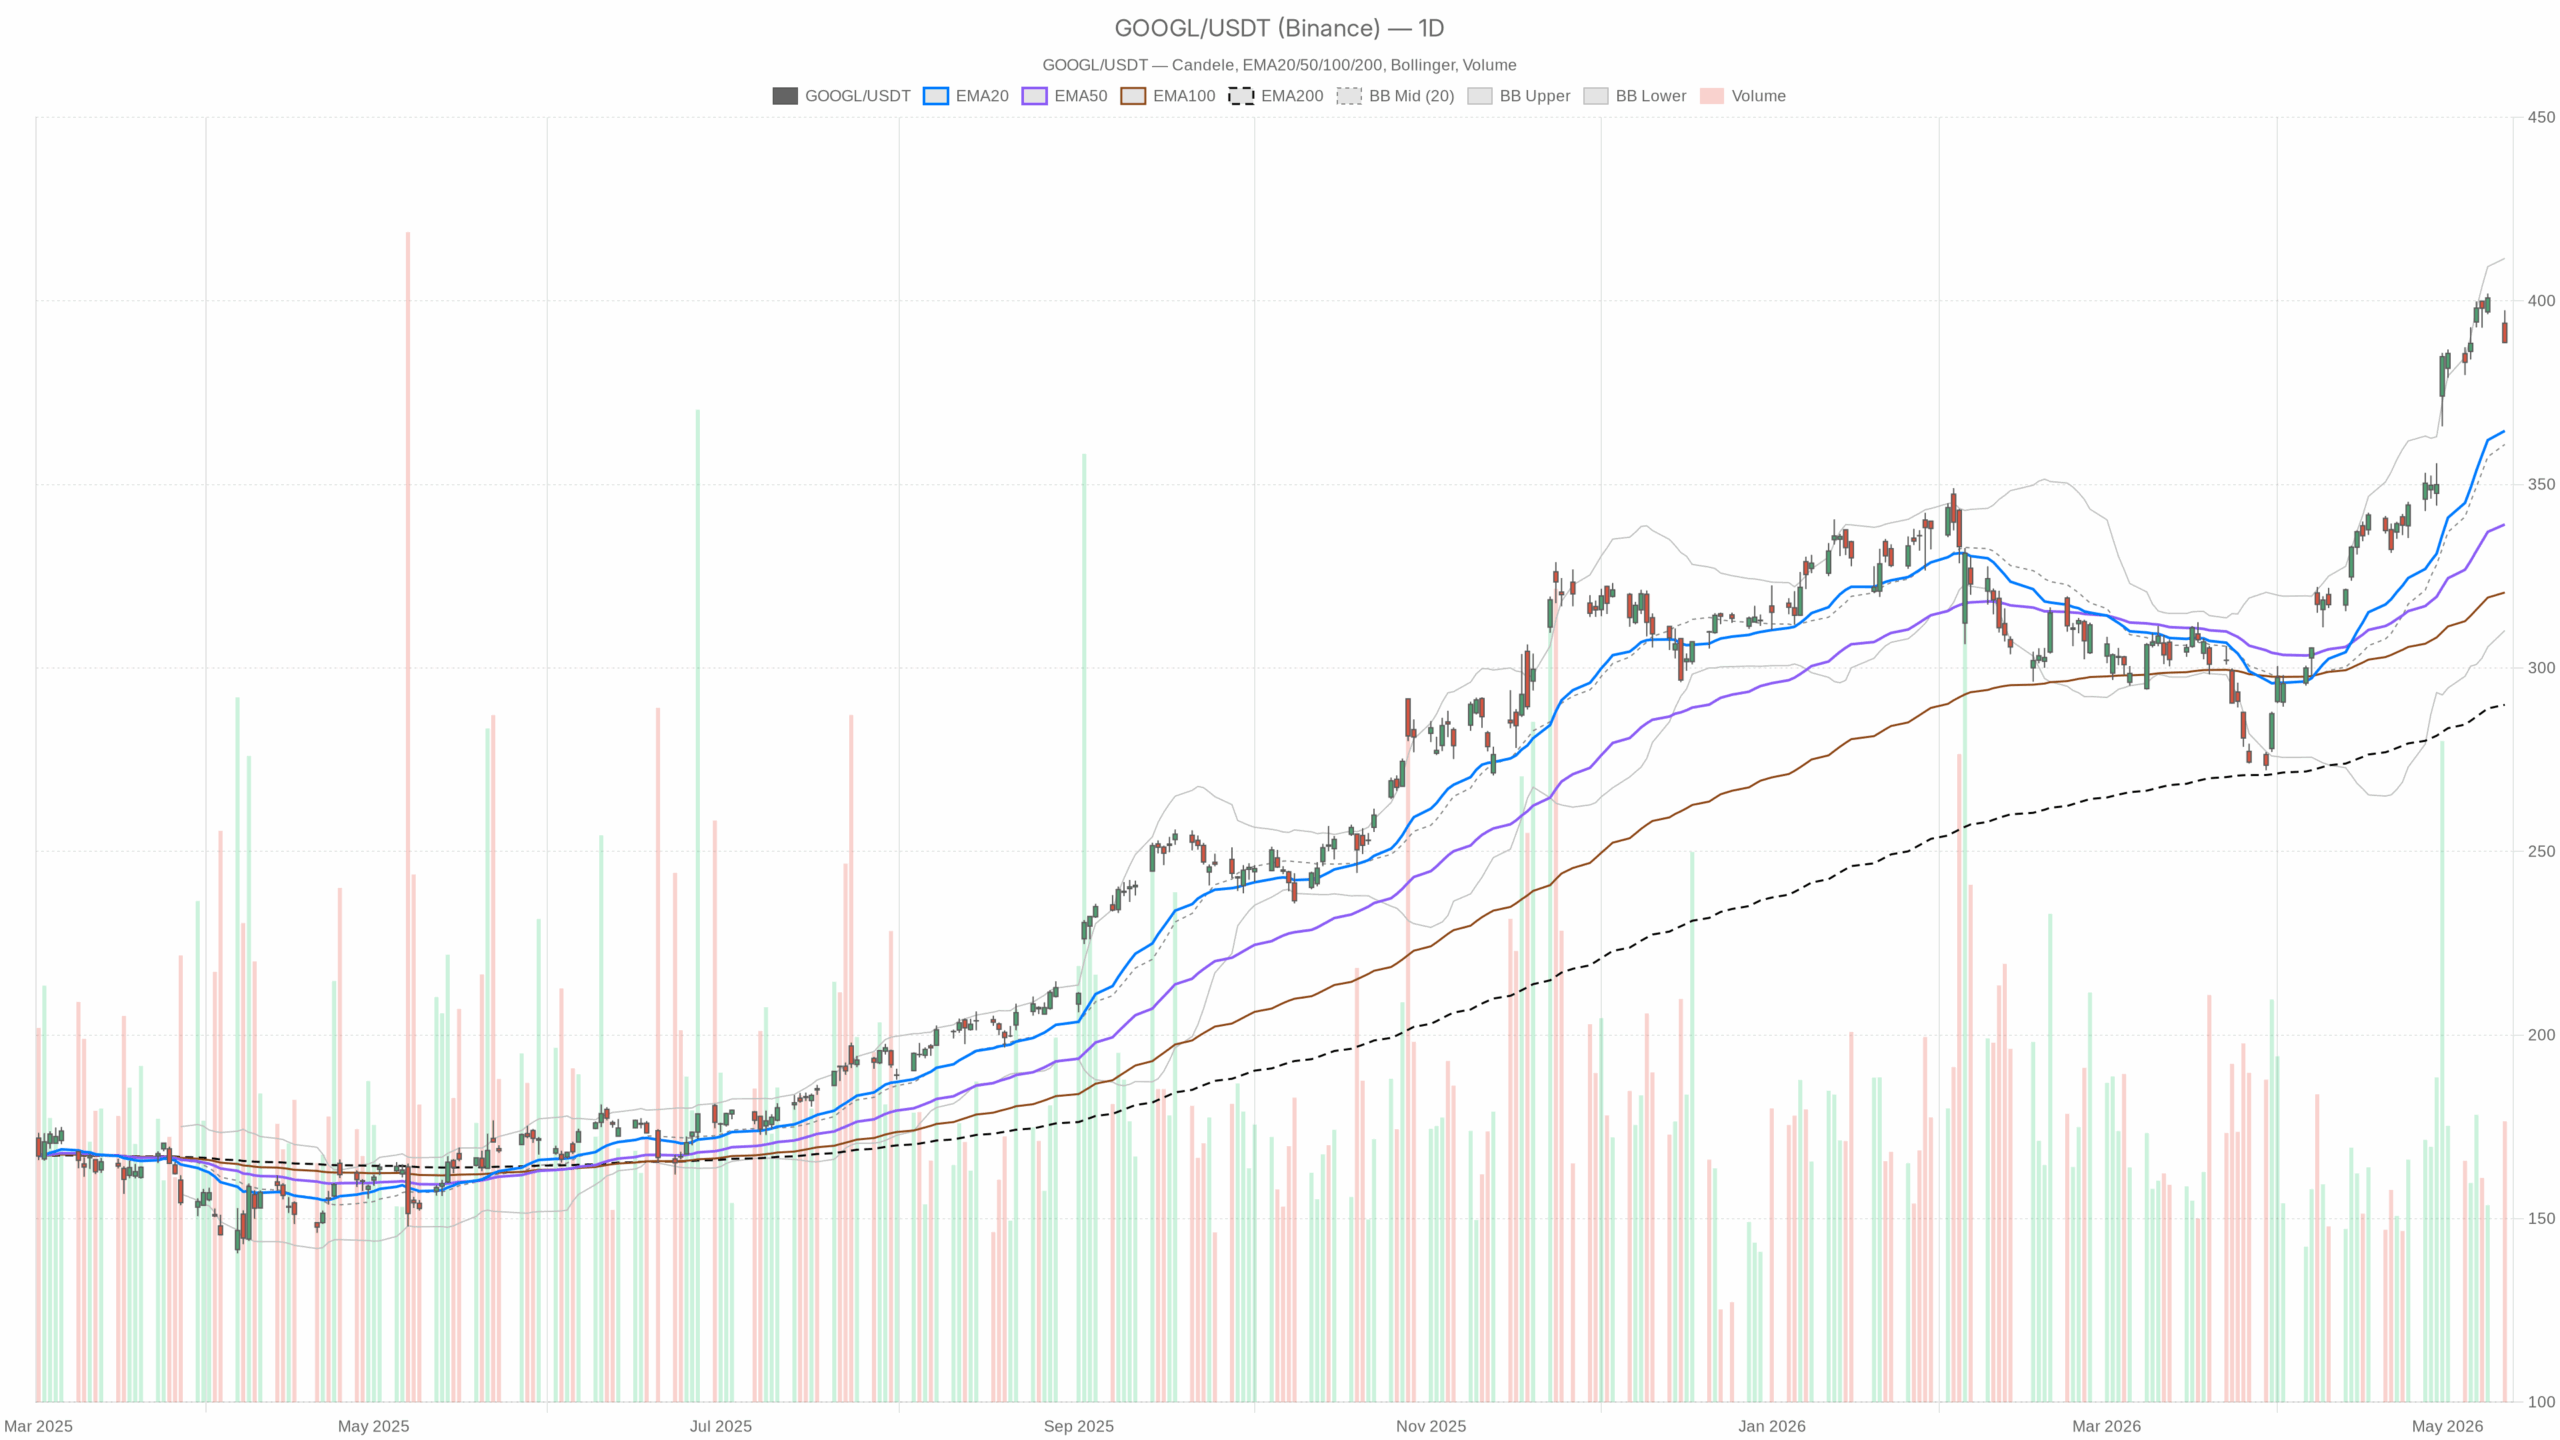 GOOGL — daily chart with candlesticks, EMA20/EMA50 and volume.
Alphabet Stock Daily Technical Overview
On the daily chart, GOOGL closed at 388.64. The regime is bullish, and trend leadership remains intact.
The EMA20 364.59, EMA50 339.1, and EMA200 289.96 are widely stacked below price, confirming a well‑established uptrend.
Meanwhile, RSI14 71.59 is elevated. The rally is extended and more vulnerable to pullback.
MACD shows the line at 21.51 versus the signal at 18.53 with a 2.98 histogram. Momentum remains positive and still dominates.
Bollinger levels place the mid at 360.89, the upper band at 411.57, and the lower at 310.2. Price sits in the upper zone, not at extremes, so there is upside room but less cushion.
Notably, ATR14 10.65 is firm, signaling active daily ranges.
Daily pivot levels show PP 391.52, R1 394.56, and S1 385.59. Price sits between PP and S1, a nearby support band.
Intraday Context: Momentum Cools Into Support
1‑Hour Setup
However, for Alphabet Stock, the 1H context softened into the close.
Price ended at 388.64, below the EMA20 394.14 but near the EMA50 387.8. That reflects short‑term pressure with initial support nearby.
The RSI14 38.62 is weak, showing buyers are losing control intraday.
MACD histogram at -1.58 with the line below the signal at 1.83 shows a downside tilt. Momentum is negative on this timeframe.
Bollinger mid at 395.92 and lower band at 389.51 left price slightly below the band. Conditions are stretched and prone to mean reversion.
Hourly ATR14 2.75 is moderate, so intraday swings can be choppy.
The hourly pivot sits at 389.4 with R1 390.3 and S1 387.74. Price is leaning on support.
15‑Minute Setup
Meanwhile, the 15‑minute tape is oversold near support.
The EMA20 392.55 and EMA50 394.44 sit above price, while the EMA200 387.18 sits below. The short‑term trend is soft, but the bigger intraday trend remains up.
RSI14 20.58 is washed out. A bounce is likely, though not guaranteed.
MACD line -1.64 versus signal -1.35 with a -0.29 histogram stays negative. Momentum remains down but is slowing.
Bollinger mid at 392.67 with a lower band at 389.58 has price trading below the band at 388.64. This often precedes snapback attempts.
The 15‑minute pivot is 389.05 with R1 389.59 and S1 388.09. Price is clustered near S1, a tactical level.
News and Sentiment for Alphabet Stock
Notably, the news backdrop still leans supportive.
Motley Fool highlighted soaring revenue and profits for Alphabet, indicating fundamentals are trending well.
Another report pointed to a rumor of a $200 billion Anthropic deal with Google Cloud. That is a sentiment tailwind for cloud demand, though unconfirmed.
Yahoo Finance flagged plans for a first yen‑denominated bond sale to fund AI infrastructure. The balance sheet is being tapped to finance growth.
Seeking Alpha cited robust AI innovation and upcoming catalysts at the May I/O event. This provides narrative support into newsflow.
Alphabet Stock Trading Scenarios: Levels That Define the Next Move
Therefore, the base case is bullish on the daily, with a near‑term consolidation bias between 385.59 and 394.56.
A stabilization above the daily pivot at 391.52 would reset momentum, showing buyers reasserting control.
Reclaiming the hourly EMA20 394.14 would confirm repair, with intraday buyers back in charge.
Bullish Scenario
For the bullish scenario, watch for a clean hold of S1 385.59 and a push through R1 394.56.
A daily close back above 391.52 and an improving 1H RSI from 38.62 would bolster the case. Intraday strength would feed the trend.
From there, price would have room toward the daily Bollinger upper band at 411.57, a trend extension area.
Bearish Scenario
On the other hand, a decisive break below 385.59 would weaken the daily structure.
Slippage under the 1H EMA50 387.8 while MACD stays negative would invite deeper mean reversion. Momentum would be turning against the trend.
In that event, the first meaningful daily dynamic support sits at the EMA20 near 364.59, where trend bulls would likely defend.
Positioning and Volatility Context for Alphabet Stock
Overall, positioning respects the uptrend but tempers near‑term expectations.
Elevated daily RSI and soft intraday momentum argue for two‑way trade with shakeouts.
With ATR14 10.65 on the daily and 2.75 on the hour, volatility remains constructive but not disorderly.
Tactically, the 385–395 zone is the battleground until catalysts turn the tape.


 English (US) ·