
 4 hours ago
14
4 hours ago
14

Atlassian Corporation stock has done something technically significant. After a violent post-earnings repricing, TEAM closed at $110.17, back above its 200-day EMA at $109.08. Reclaiming that defining level on a 37.4% earnings gap changes the chart’s character, even if the daily regime remains neutral.
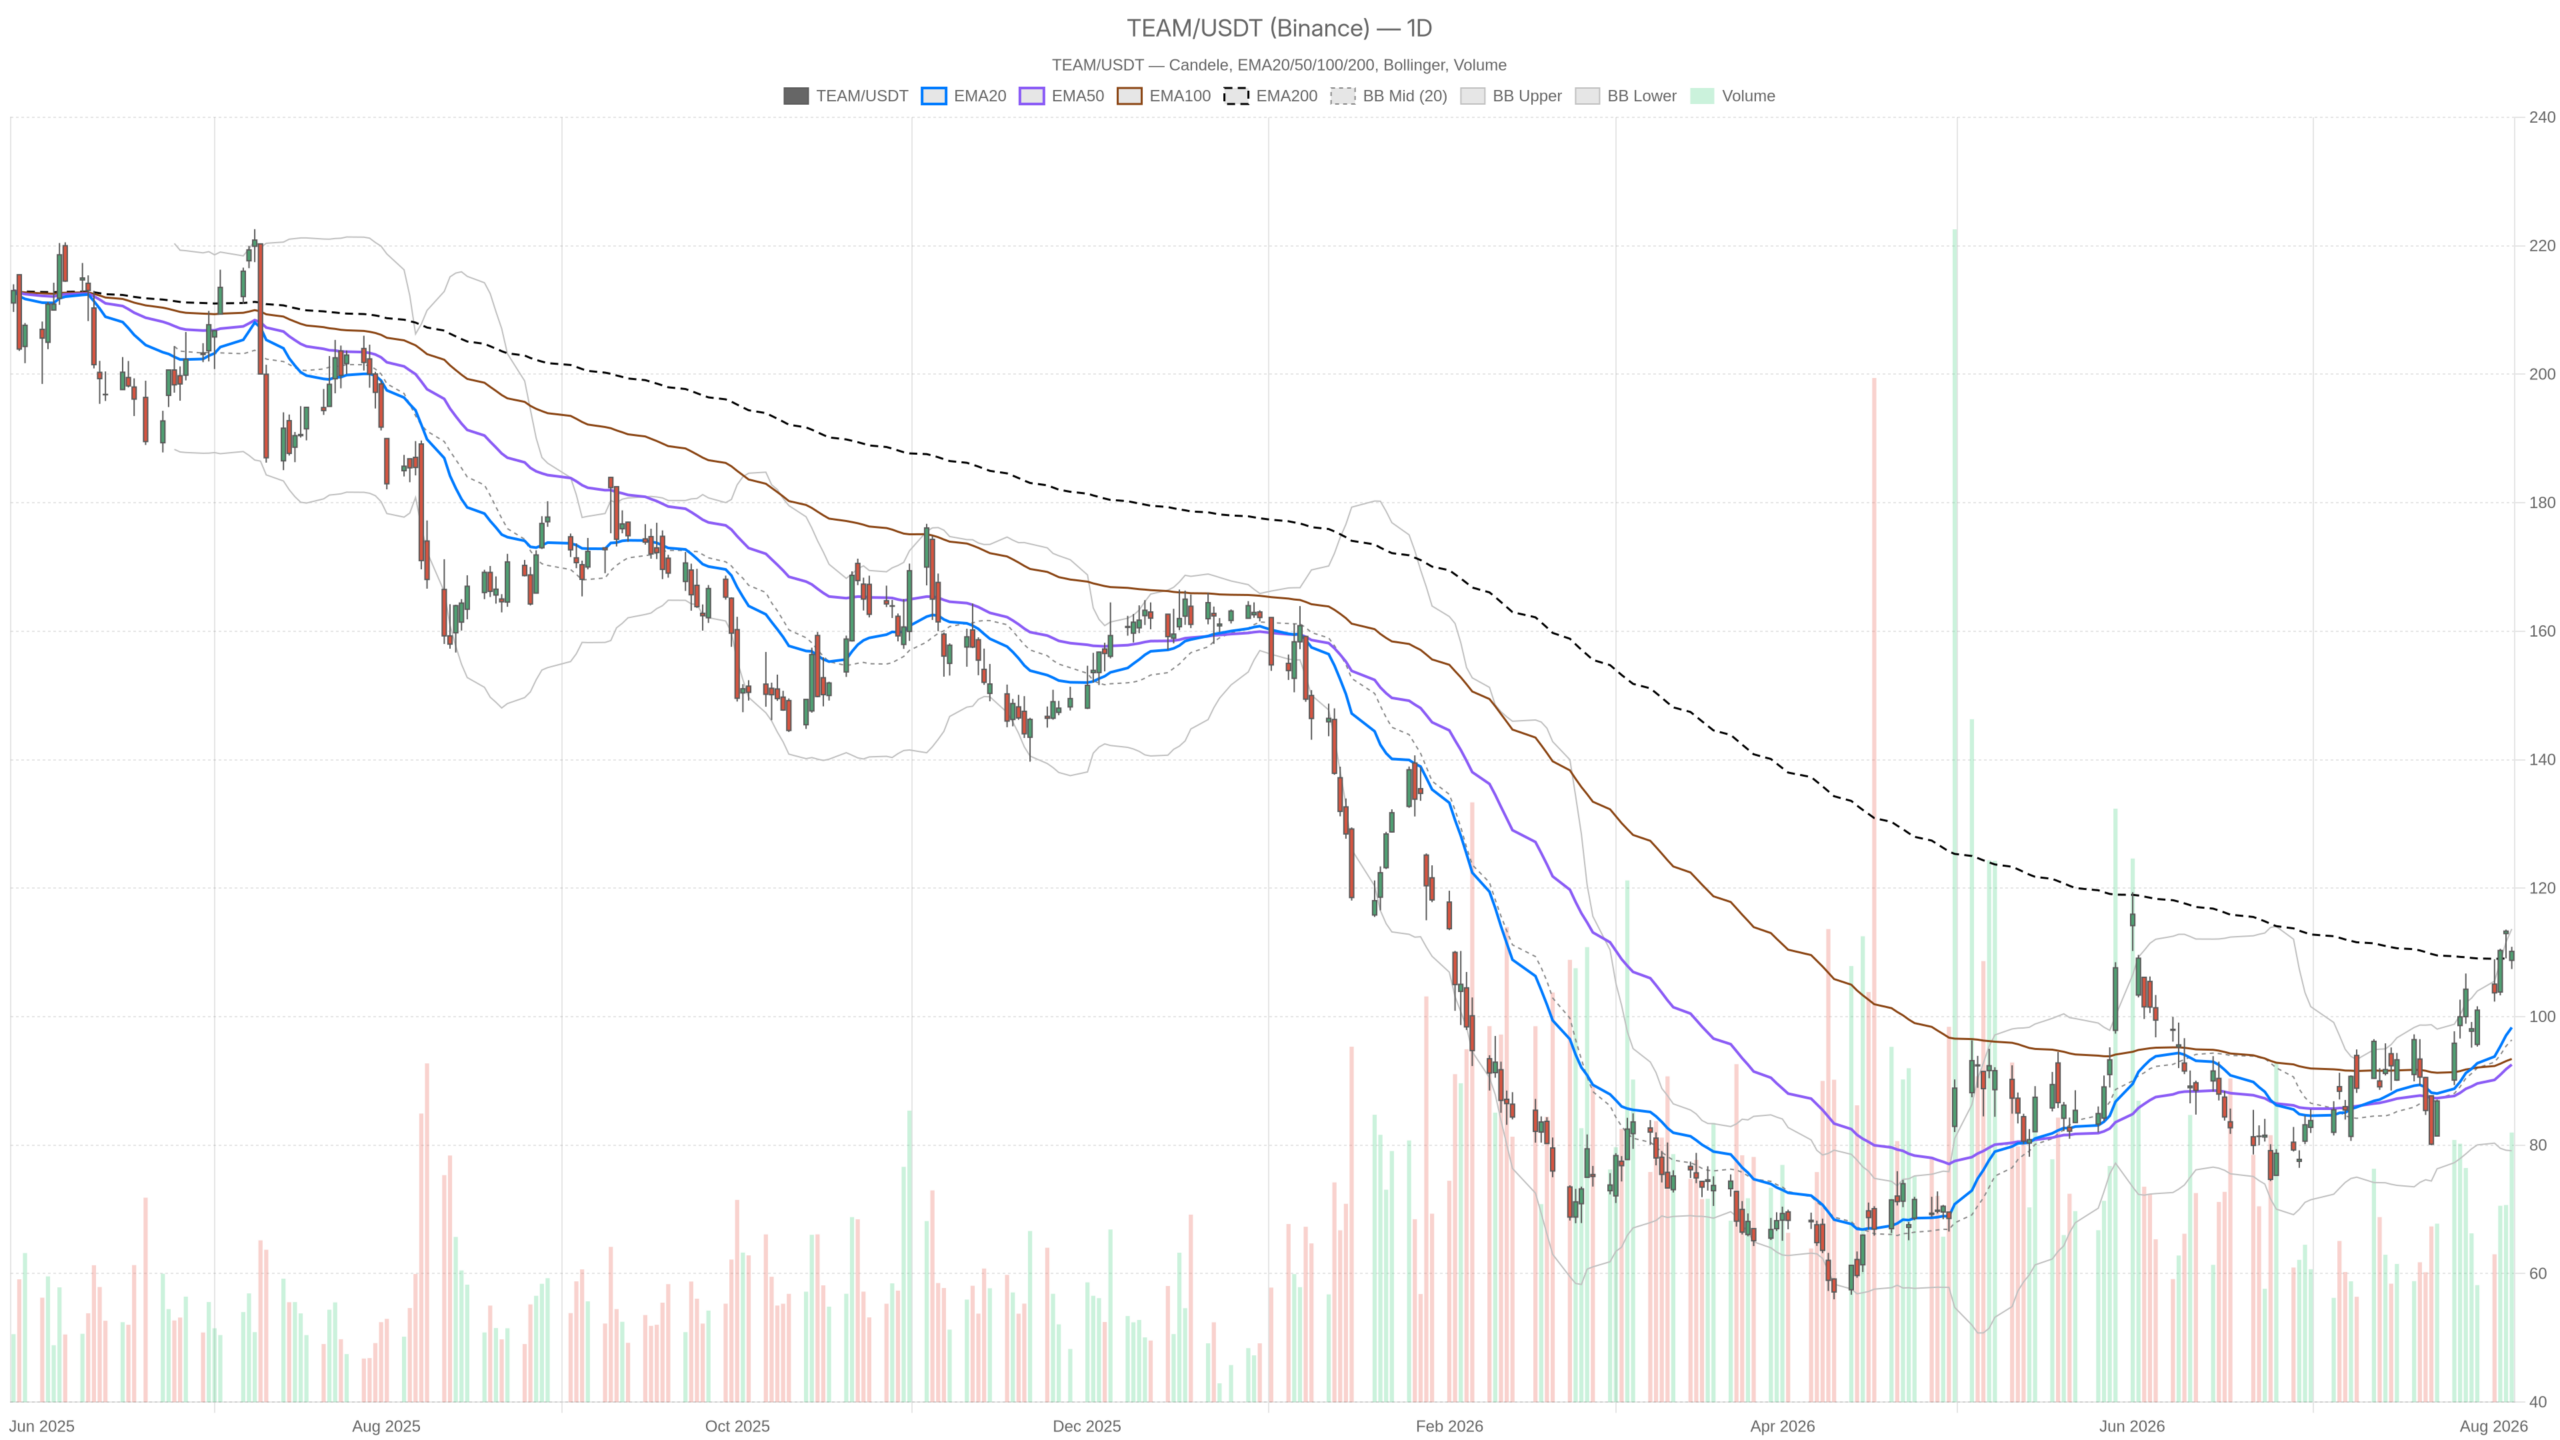 TEAM — daily chart with candlesticks, EMA20/EMA50 and volume.
Key takeaways
- TEAM surged 37.4% post-earnings, closing at $110.17 and reclaiming the 200-day EMA at $109.08.
- Atlassian reported Q4/FY2026 revenue of $1.77 billion, up 27.6% year on year, with next-quarter guidance 2.8% above consensus.
- The daily chart shows momentum building: RSI at 63 and MACD expanding with a 2.00 histogram — but the daily regime remains officially neutral.
- Daily ATR has widened to 7.25, meaning normal swings can erase or extend gains rapidly without altering the structure.
- The hourly trend is bullish with stacked EMAs, yet hourly MACD has already crossed bearish, signalling digestion rather than continued thrust.
Why the Daily Chart in Atlassian Corporation Stock Is Constructive but Not Yet Confirmed
The daily chart is constructive because TEAM has reclaimed the 200-day EMA on a 37.4% earnings surge. However, one candle does not confirm a trend, and the regime remains neutral.
The fundamental trigger is clear. Atlassian reported Q4 and fiscal 2026 revenue of $1.77 billion, up 27.6% year on year and ahead of Wall Street estimates. Next-quarter guidance came in at $1.71 billion at the midpoint, 2.8% above consensus. Beats on both the print and the outlook force gap-driven trend changes, not simple relief bounces.
Daily Structure and the 200-Day EMA Flip
The daily structure is now stacked unusually. Price at $110.17 sits far above the 20-day EMA at $98.33 and the 50-day EMA at $92.55. That is a textbook signature of a gap rather than a grind. Meanwhile, the 200-day EMA at $109.08 has flipped from ceiling to potential floor. The reclaim is fresh and fragile, sitting only just below spot.
Momentum Supports the Move Without Exhaustion
Notably, momentum supports the move without screaming exhaustion. Daily RSI sits at 63, firmly in bullish territory but short of overbought extremes. MACD is expanding, with the line at 5.67 against a 3.67 signal and a histogram of 2.00. The impulse is still building rather than fading.
Volatility Complicates the Picture
However, volatility is the harder problem. Daily ATR has widened to 7.25, and Bollinger Bands span from $79.13 to $113.65 around a $96.39 midline. Price is now pressed toward the upper band. A normal daily swing can cover several dollars in either direction without altering the structure.
Meanwhile, daily pivots frame the immediate battlefield tightly: pivot at $109.49, resistance at $111.56, support at $108.10. Notably, that entire band is narrower than a single ATR. Traders reading those levels as hard barriers will be run over repeatedly in this volatility regime.
The 1H Chart Confirms Trend, But Momentum Is Already Cooling
The hourly chart provides the cleanest bullish evidence with EMAs stacked in order. However, hourly momentum indicators show the acceleration phase has already paused.
The 1H regime is bullish, with EMAs stacked in order: 20-period at $109.01, 50-period at $105.15, 200-period at $96.04. Price at $110.28 sits above all three. That is trend alignment, not noise.
However, hourly momentum has started to lose thrust. The 1H MACD line at 1.37 has crossed below its signal at 1.95, leaving a histogram of -0.58. RSI has cooled to 57.65. The trend is intact, but the acceleration phase has paused.
This is the central conflict in Atlassian Corporation stock right now. The daily is powerfully impulsive; the hourly is already digesting. That combination usually resolves into either a shallow consolidation above the reclaimed 200-day EMA. Alternatively, it could produce a fast retest lower to shake out late buyers.
Hourly Bollinger data reinforces the digestion read. The midline sits at $110.12, essentially where price closed, with bands at $106.96 and $113.28. Price mean-reverting to its hourly average after a vertical move is normal behaviour. Hourly ATR of 2.13 shows how much room that digestion can occupy.
15-Minute Context: Balance, Not Breakout
The 15-minute chart shows a market in balance rather than breakout mode. Flat overlapping EMAs and neutral momentum readings define a tight working range.
On the execution timeframe the tone is neutral rather than directional. The 15m close of $110.28 sits marginally above the upper Bollinger band at $110.07, pointing to short-term stretch. The 20-period EMA at $109.20 and 50-period EMA at $109.40 are flat and overlapping — compression, not momentum.
Still, there is a mild positive tilt underneath. The 15m MACD histogram has turned slightly positive at 0.15, and RSI reads 56.14. The 200-period EMA at $104.35 remains well below price. Intraday ATR of 0.94 and pivots at $109.87, $111.04 and $109.12 define a tight working range for near-term timing.
The Bullish Scenario
The bullish scenario requires TEAM to hold above the $109.00–$109.50 confluence and build a base from the earnings gap. Initial targets sit at $111.00–$111.56.
Bulls need TEAM to hold above the $109.00–$109.50 confluence. That zone is where the daily 200-day EMA, the daily pivot, and the hourly 20-period EMA overlap. Acceptance above that shelf turns the earnings gap into a base.
Thereafter, the first objective is the $111.00–$111.56 pivot resistance cluster. Beyond it, the daily upper Bollinger band at $113.65 and the hourly band at $113.28 mark the next logical friction zone. A rebuilding hourly MACD, with the histogram flipping positive, would confirm the pause was only temporary.
The Bearish Scenario
The bearish case simply requires the earnings gap to fail. A decisive loss of $108.10 support would put price back below the 200-day EMA.
The bearish case does not require bad news. It only requires the gap to fail. A decisive loss of $108.10 daily support would put price back under the 200-day EMA. That would reopen the argument that this was a liquidity spike into resistance.
Below that, the hourly lower band at $106.96 and the hourly 50-period EMA at $105.15 become the reference points. Given a daily ATR of 7.25, such a retracement could unfold in a single session without breaking the hourly EMA stack.
What would truly invalidate the bullish thesis is a sustained close back beneath $105. That would leave the earnings reaction fully retraced.
Positioning Into an Unresolved Range
Positioning in Atlassian Corporation stock requires respecting the unresolved range between $108.10 and $111.56. Volatility — not direction — is the dominant challenge.
Overall, the signals in Atlassian Corporation stock are constructive but genuinely mixed. The daily chart shows a momentum breakout that has reclaimed a defining long-term average. In contrast, hourly momentum is already fading. The 15-minute picture is balanced and slightly stretched.
The practical issue is volatility, not direction. Post-earnings ATR readings this wide compress the value of tight technical levels and widen the cost of being wrong. Until price either accepts above $111.56 or loses $108.10, the market is repricing a stronger business. It has not yet decided where fair value sits.
FAQ
Is Atlassian Corporation stock a buy after the 37.4% earnings gap?
The technical picture is constructive but unconfirmed. TEAM reclaimed the 200-day EMA at $109.08, but the daily regime remains neutral and hourly momentum is already cooling. A confirmed hold above the $109.00–$109.50 confluence would strengthen the bullish case.
What are the key levels to watch in TEAM stock?
Immediate support sits at $109.00–$109.50, where the 200-day EMA and daily pivot converge. Below that, $108.10 is the critical daily support. Resistance stands at $111.00–$111.56, with the daily upper Bollinger band at $113.65 as the next upside target.
What drove the 37.4% surge in Atlassian Corporation stock?
Atlassian reported Q4/FY2026 revenue of $1.77 billion, up 27.6% year on year, beating Wall Street estimates. Next-quarter guidance came in at $1.71 billion, 2.8% above consensus. Beats on both the print and the outlook triggered the gap-driven repricing.
Disclaimer: This article is for informational purposes only and does not constitute financial advice, an investment recommendation, or a solicitation to buy or sell any financial instrument or cryptocurrency. The analysis provided is not indicative of future results. Investing in crypto assets and financial markets carries a high risk of capital loss. Always do your own research (DYOR) and consult a qualified financial advisor before making any decision.
Article produced with the assistance of artificial intelligence and reviewed by the editorial team.







 English (US) ·