
 6 hours ago
13
6 hours ago
13
Baidu stock sits at a critical technical juncture. After a roughly 30% year-to-date decline, BIDU closed at $104.12, testing the $104.28 intraday high. The daily trend remains bearish, yet short-term buyers are pushing back just as markets brace for Q2 earnings.
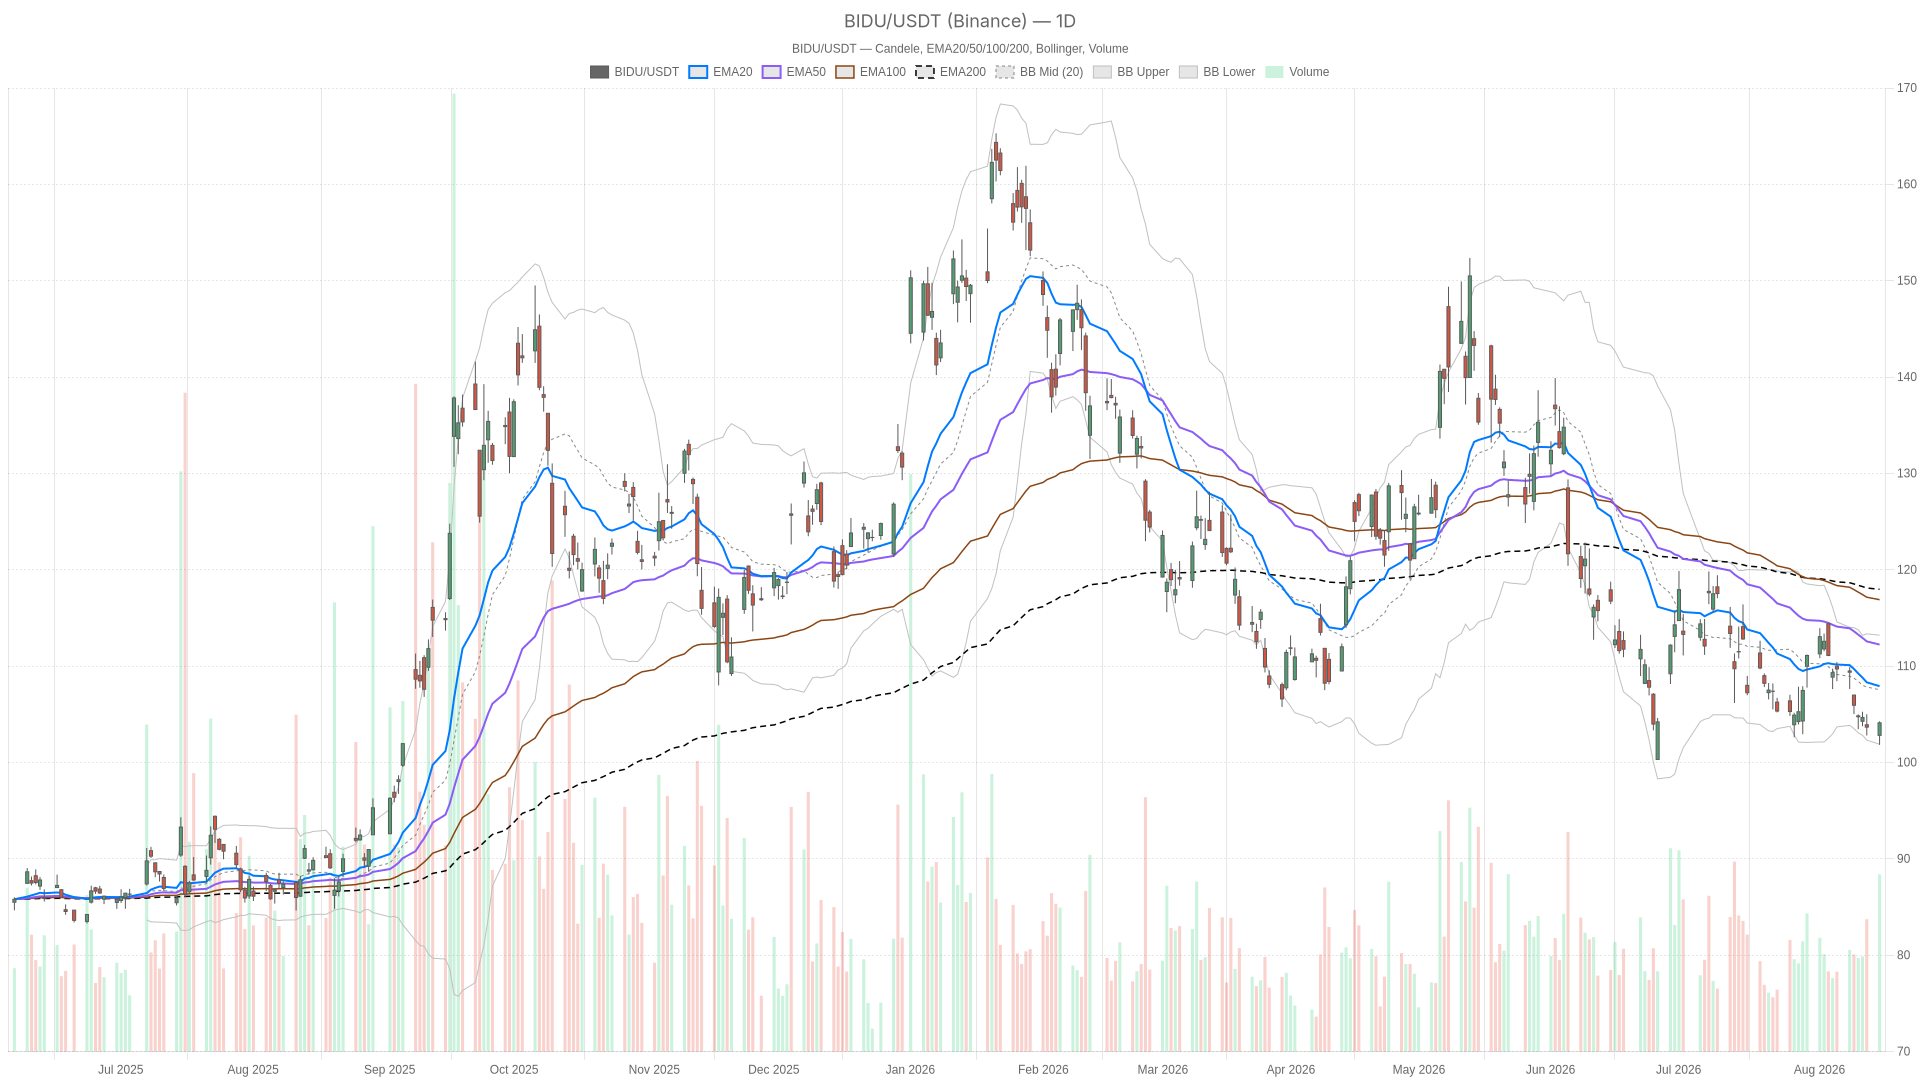 BIDU — daily chart with candlesticks, EMA20/EMA50 and volume.
Key takeaways
- Baidu stock closed at $104.12, up from a $102.82 open and testing the $104.28 intraday high.
- The daily chart remains bearish, with price below the EMA20 (107.92), EMA50 (112.24), and EMA200 (117.97).
- Daily RSI14 sits at 37.95, while MACD is negative with a histogram of -0.28.
- The 1-hour and 15-minute charts show a tentative short-term bounce, but the 15-minute EMA200 at 105.64 still caps upside.
- Q2 earnings are approaching as analyst sentiment splits between valuation appeal and margin concerns.
Baidu Stock Daily Trend: Bearish Structure Still in Control
The daily trend remains firmly bearish. Price sits below all three key moving averages: EMA20 at 107.92, EMA50 at 112.24, and EMA200 at 117.97. That stacked bearish alignment confirms a well-established downtrend rather than a temporary pullback. The daily regime reading itself is classified as bearish, and the moving average structure backs that up cleanly.
Meanwhile, RSI14 at 37.95 reinforces the same message. It is not yet oversold, but it sits in bearish momentum ground. Sellers still have room to press before any exhaustion signal appears. MACD adds further confirmation: the line at -2.04 remains below the signal at -1.75, with a histogram of -0.28. Momentum is negative, though the shrinking histogram hints that downside pressure may be starting to ease.
Bollinger Bands add useful context. The mid-band sits at 107.55, the upper band at 113.21, and the lower band at 101.89. Wednesday’s close near 104.12 places price close to the lower boundary. That typically reflects an oversold stretch within a downtrend. In such zones, short covering or bargain-hunting can trigger relief bounces, even without a change in the primary trend. ATR14 at 2.99 confirms that volatility remains elevated, which matters heavily heading into earnings season.
Pivot levels reinforce the tactical picture. The daily pivot point sits at 103.41, with resistance at r1 (104.99) and support at s1 (102.54). Price closed above the pivot and is pressing toward r1. That is a modest positive sign, but nothing that overturns the broader bearish framework on its own.
BIDU 1H Timeframe: A Fragile Attempt at Stabilization
The 1-hour chart shows a fragile stabilization attempt, not a confirmed reversal. Price closed at 104.17, holding above the EMA20 (103.82) but still below both the EMA50 (105.41) and EMA200 (108.36). That is a mixed signal. Short-term buyers have regained some control, but the broader intraday structure remains capped by longer moving averages.
RSI14 at 49.59 sits right at neutral, offering no strong directional bias on its own. However, MACD on the 1H shows the line at -0.66 versus a signal of -0.86, with a positive histogram of 0.21. That is a tentative bullish crossover forming inside what is still technically a corrective bounce. Bollinger Bands on this timeframe show price near the upper band (104.93) against a mid-line of 103.65. Short-term momentum has room to extend, but it is also approaching resistance. The 1H regime is labeled neutral, essentially acknowledging that the bounce has stalled the bearish momentum without yet reversing it.
Pivot data on the 1H frame shows price above the pivot (103.92) and testing r1 at 104.52. Support is well defined at s1 (103.56). Overall, the 1H timeframe weakens the daily bearish conviction just enough to suggest hesitation among sellers. It does not provide a full reversal signal.
15-Minute Execution Context for BIDU
The 15-minute chart shows the strongest short-term momentum of the three timeframes. Notably, RSI14 has climbed to 67.7, approaching overbought territory and confirming that buyers have driven a sharp push. MACD is positive as well, with the line at 0.16 above the signal at 0.02 and a histogram of 0.14. Price has also moved above the upper Bollinger Band (103.86). That signals an aggressive short-term breakout attempt rather than a slow grind higher.
At the same time, EMA200 on the 15m chart sits at 105.64, still above current price. Even this short-term strength has not yet cleared the broader intraday resistance zone. Pivot levels here show price trading beyond r1 (104.50). That is typically a sign of strong immediate momentum, though such moves often need consolidation before extending further. For traders, the 15-minute setup is purely tactical. It should be read as timing context, not as a trend-defining signal.
Bullish Scenario for Baidu Stock
The bullish case requires Baidu stock to reclaim and hold key resistance levels. BIDU would need to push convincingly through the daily pivot at 103.41 and then through r1 at 104.99. A daily close above the EMA20 (107.92) would be an important technical shift. It would show that the bounce has enough strength to challenge the broader trend structure rather than fade within it.
On the fundamental side, news flow around Q2 earnings could act as a catalyst if results surprise positively. Wall Street is closely watching AI growth against advertising weakness and margin trends. Some analysts have also noted that BIDU screens as cheap on market multiples after the steep drop. That could support a valuation-driven rebound if sentiment stabilizes.
Bearish Scenario for BIDU
The bearish case remains the path of least resistance until proven otherwise. A rejection near daily r1 (104.99) or a failure to hold the 1H EMA20 (103.82) would likely reassert seller control. A breakdown below s1 at 102.54 on the daily chart would open the door toward the lower Bollinger Band near 101.89. That would reinforce the primary downtrend.
Fundamentally, recent commentary has highlighted ongoing struggles in Baidu’s core advertising business and declining margins. Those concerns were serious enough to prompt a rating downgrade despite the stock’s apparent cheapness. Meanwhile, a recent session saw shares close at $105.93 after a -3.26% single-day move. That reflects a market still uneasy about near-term execution risk.
Closing Take on Baidu Stock
Overall, Baidu stock presents a classic conflict between timeframes. The daily trend is bearish, momentum indicators confirm it, and price remains well below every major moving average. Meanwhile, the 1H and 15m charts show a short-term bounce gaining traction, with momentum indicators turning positive and price testing intraday resistance. Therefore, this looks less like a confirmed reversal and more like a volatility-driven bounce inside a larger downtrend. ATR readings remain elevated across timeframes.
With Q2 earnings approaching, analyst sentiment is split between valuation appeal and margin concerns. Positioning around BIDU stock will likely require patience and tight risk control. Close attention is needed to whether the daily structure can actually shift, or whether this bounce simply fades back into the broader downtrend.
FAQ
Is Baidu stock in a daily downtrend?
Yes. The daily chart is classified as bearish, with price below the EMA20 (107.92), EMA50 (112.24), and EMA200 (117.97). Daily RSI14 sits at 37.95, and MACD remains negative.
What is the short-term setup for BIDU?
The 1-hour and 15-minute charts show a tentative bounce. The 15-minute RSI14 has climbed to 67.7, while price trades above the upper Bollinger Band (103.86). However, the 15-minute EMA200 at 105.64 still caps upside.
What levels matter most for Baidu stock?
The daily pivot sits at 103.41, with resistance at r1 (104.99) and support at s1 (102.54). A daily close above the EMA20 (107.92) would signal strength, while a break below s1 would reinforce the downtrend.
Why is Baidu stock volatile heading into Q2 earnings?
ATR14 sits at 2.99, confirming elevated volatility. Wall Street is watching AI growth against advertising weakness and margin trends, while a recent session closed at $105.93 after a -3.26% single-day move.
Disclaimer: This article is for informational purposes only and does not constitute financial advice, an investment recommendation, or a solicitation to buy or sell any financial instrument or cryptocurrency. The analysis provided is not indicative of future results. Investing in crypto assets and financial markets carries a high risk of capital loss. Always do your own research (DYOR) and consult a qualified financial advisor before making any decision.
Article produced with the assistance of artificial intelligence and reviewed by the editorial team.








 English (US) ·