
 1 hour ago
29
1 hour ago
29
The Bitcoin to gold spread made a huge all-time high of 41 ounces of gold to 1 $BTC in December 2024. Since then a Bitcoin bear market swung the spread very much in favour of gold, and reached a low of nearly 12 ounces to 1 $BTC in March 2026. However, after reaching a local high of 20 ounces this week, could the $BTC/Gold spread be on the way back to 41 ounces?
W pattern breakout for $BTC against Gold
Source: TradingView
The one week chart for the Bitcoin/GOLD spread illustrates the big plunge taken by the $BTC price while at the same time the gold price rose dramatically. This ended in a low of almost 12 oz of gold to 1 $BTC, which also must be acknowledged as a higher low for Bitcoin.
Once the spread did hit that low, a bullish W bottoming pattern began to form. This pattern completed and broke out earlier this week, also breaking through a resistance level at 19.2 oz. The measured move for the pattern is to around 24 oz - slightly below the 24.5 horizontal resistance.
Fibonacci extension levels have been drawn in from the second of the highs down to the low at nearly 12 oz. Their extraordinary accuracy can be seen with the 0.236, the 0.382, and the 5.0 levels all aligning perfectly with the main resistance levels up to 24.5 oz.
At the bottom of the chart, the RSI indicator line can be seen to have recently broken through a descending trendline that began to form back in March 2024. Look for this indicator line to continue climbing as the $BTC price continues to outperform gold.
Breakout about to happen in short-term time frame
Source: TradingView
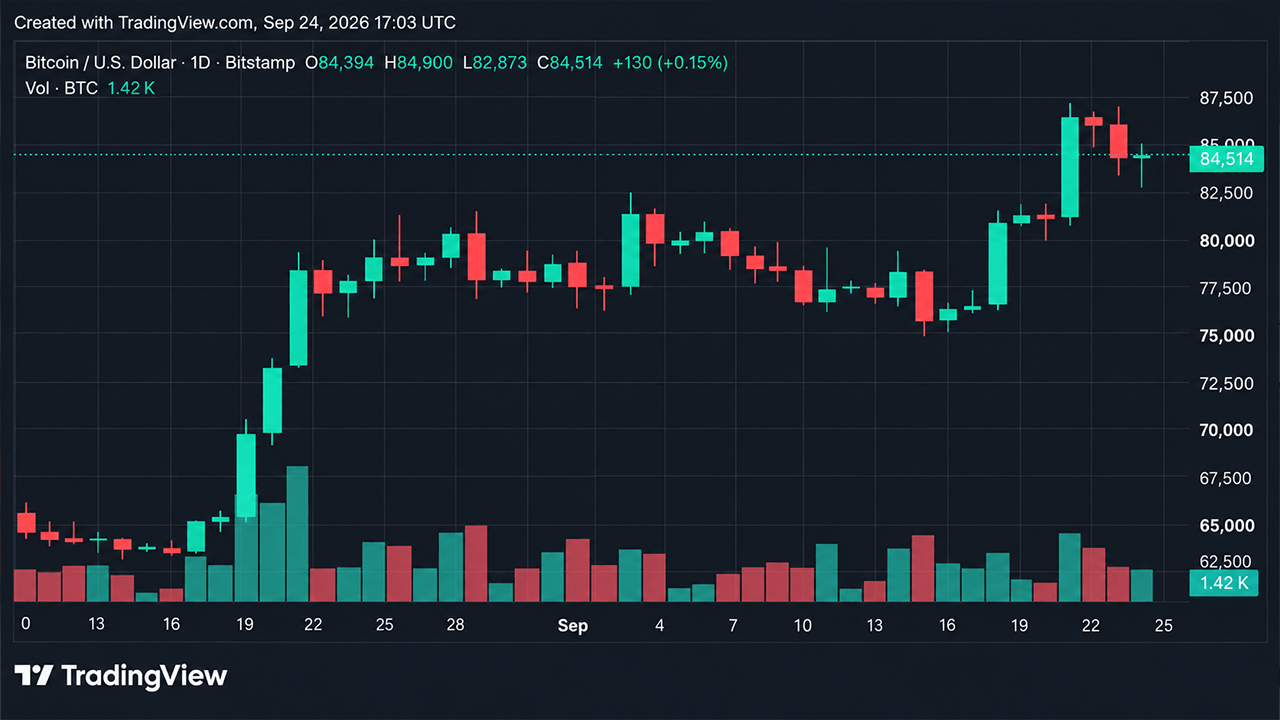
The short-term time frame for $BTC shows that since the dip from $87K to $83K, the price has just gone sideways, generally keeping within the limits of a narrow range. Drawn into the chart is a triangle formation, that if valid, would have the $BTC price breaking out in the very near future.
As can be seen, that breakout is possibly even taking place now. If it does happen, and it is successful, the full measured move would take the price up to the $89,250 horizontal resistance level.
$BTC price to climb after retest and confirmation of major support
Source: TradingView
The daily time frame reveals that the correction back to $82,830 in order to confirm that level as support was probably a sound structural move that puts a firm base under the price. It might well be expected that the $BTC price climbs higher from here.
The RSI at the bottom of the chart displays a relatively short downtrend line that was breached when the $BTC price exploded out of the top of the parallel channel. As long as the indicator line stays above this trendline it is likely to signal more upside price action.
Potential for bullish candle close on Sunday
Source: TradingView
The current weekly candle will be analysed intently when it closes at the end of play on Sunday. Some of the long wick to the upside, visible on Thursday, has now been eaten up by the main candle body. This could continue into the weekend, and if the candle body is above $85,000, or even $86,715 at midnight on Sunday, this would be very bullish going into next week.
Bitcoin still has legs in this ongoing rally. It just remains to be seen how far the $BTC price can climb before that first big retracement. On the other side of the bear market trendline it can be seen that the two big bear flags were in the order of 10 weeks and then 17 weeks. So far we’ve just had a 5-week bull flag in this rally. Something much bigger will occur eventually, and it may not be that far off.
Disclaimer: This article is provided for informational purposes only. It is not offered or intended to be used as legal, tax, investment, financial, or other advice.








 English (US) ·