
 3 months ago
79
3 months ago
79
- Bitcoin pushed above $73K but quickly fell back under the key $71,500 resistance level.
- Repeated rejections suggest buying momentum may be weakening.
- If BTC loses $70K support, the next downside area could appear near $68K.
Bitcoin briefly looked ready to charge higher again after pushing above the $73,000 mark, a move that stirred fresh optimism across the market. Traders started to wonder if the rally still had more fuel left in it. But the excitement faded quickly when the price lost momentum and slid back under $71,500, a level that once again proved stubborn.
That quick rejection reminded everyone of something important. This zone hasn’t been easy to break, not lately anyway. The market keeps testing it, and each time the price gets turned away, the message becomes a little clearer.
Repeated Rejections Signal Fading Momentum
This latest pullback wasn’t just a random dip on the chart. Bitcoin has challenged this area several times in recent sessions and hasn’t managed to push through, and that pattern tends to mean something.
Usually, when buyers keep hammering resistance from below, it eventually cracks. But this time the opposite seems to be happening. The recent rally actually lost steam earlier than the previous one, forming a lower high before BTC could really pressure the ceiling again.
That kind of structure can be an early warning sign. Momentum, instead of building, might actually be starting to cool off a bit.
Why $71,500 Still Matters for Bitcoin
At first glance the price movement looked like harmless sideways trading. Just another pause in a larger trend. But slowly the mood is shifting.
Traders are no longer treating $71,500 like a small hurdle. It’s beginning to feel more like a wall, and once the market starts seeing a level that way, behavior changes pretty quickly.
Short sellers often grow bolder when price keeps getting rejected at the same spot. Meanwhile bullish traders get a little more cautious. Some trim position sizes, others tighten risk management… and a few simply step aside to wait for clarity.
That shift in attitude tends to drain momentum candle by candle.
A Key Level From Bitcoin’s 2025 Breakout
The importance of this price area actually traces back to mid-2025. At the time, $71,500 capped a long consolidation range for Bitcoin, acting as a stubborn ceiling for months.
When BTC finally broke above it, the market exploded higher. The rally accelerated and eventually carried Bitcoin all the way toward roughly $126,000 by October.
Levels like that rarely lose significance. When price revisits them later, traders remember. They watch closely, because those old breakout zones often turn into major decision points.
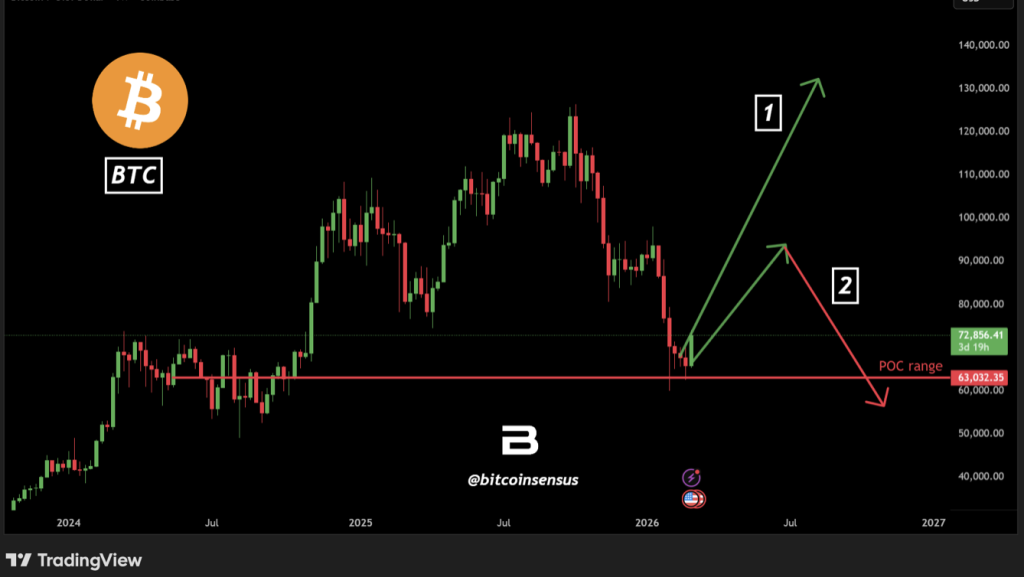
According to Bitcoin analyst Bitcoinsensus, the current price structure suggests BTC could move in either direction from the high-volume point of control. Bitcoin may continue higher from the $70,500 region, or it could face rejection and drift back toward the lower POC zone around $63,000.
What’s happening now fits that idea pretty well. Bitcoin isn’t reacting to a random number on the chart — it’s revisiting a level that once triggered a huge breakout.
Macro Forces Add Pressure to the Market
Beyond the charts, the broader market environment hasn’t exactly helped. Oil prices have been climbing again as tensions in the Middle East raise concerns about supply disruptions.
That shift is quietly bringing inflation worries back into the conversation. Normally, investors would move capital into government bonds for safety in moments like this.
But things are a bit unusual right now. Treasury yields are rising as well, which suggests markets are slowly accepting that interest-rate cuts may take longer than expected.
That type of environment usually puts pressure on risk assets. When yields climb, borrowing costs rise too, and speculative trades become harder to justify. Assets like Bitcoin often feel that squeeze.
ETF Demand Supports BTC, But Resistance Holds
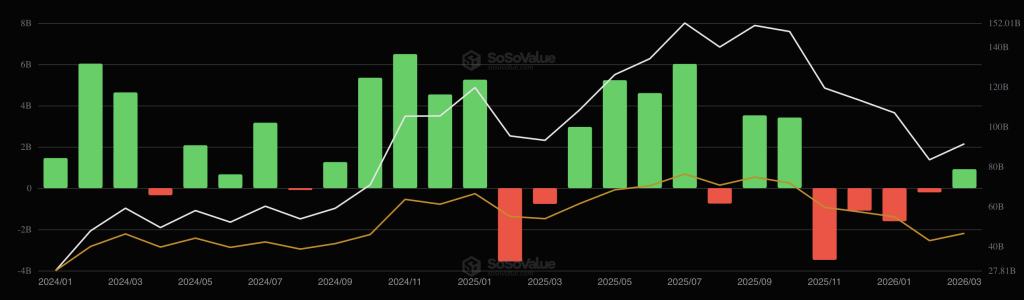
Bitcoin ETFs have provided some support lately. After weeks of outflows, several strong inflow days have returned, giving the market a modest boost.
Even so, that demand hasn’t been strong enough to force a clean breakout above the stubborn resistance zone. That alone tells traders something important — there’s still significant selling pressure waiting above.
If Bitcoin fails to hold the $70,000 region, the market could start drifting toward $68,000. Once key support levels break, selling pressure often accelerates as traders rush to reduce exposure.
In that scenario, leveraged long positions could be forced to close, which sometimes triggers quick downward spikes.
For now though, BTC remains trapped inside a fairly tight range. Resistance sits just overhead while support waits not far below, leaving the market in a kind of tense equilibrium.
The next push toward $71,500 could end up being decisive. It should reveal whether buyers still have the strength to defend this zone — or if the market’s momentum is quietly fading again.
Disclaimer: BlockNews provides independent reporting on crypto, blockchain, and digital finance. All content is for informational purposes only and does not constitute financial advice. Readers should do their own research before making investment decisions. Some articles may use AI tools to assist in drafting, but every piece is reviewed and edited by our editorial team of experienced crypto writers and analysts before publication.


 English (US) ·