
 2 hours ago
21
2 hours ago
21
- Bitcoin, Ethereum and XRP are showing early signs of stabilization after steep weekly losses.
- BTC reclaimed $60,000, while ETH is holding above $1,500 and XRP is trying to defend the $1.00 level.
- Technical indicators suggest bearish pressure is easing, but major resistance zones still block a stronger recovery.
Bitcoin, Ethereum and XRP are trying to steady themselves after a rough week across the crypto market. All three assets posted heavy losses, with Bitcoin falling nearly 6%, Ethereum dropping around 8%, and XRP losing close to 7%.
For now, the market is not exactly bullish. Not yet. But the latest price action is giving traders some hope that the worst of the short-term selling may be cooling off.
Bitcoin has moved back above $60,000, Ethereum is holding near the important $1,500 support zone, and XRP is attempting to stabilize around the key $1.00 psychological level. These areas matter, because losing them could invite another wave of selling.
Bitcoin Attempts a Mild Recovery
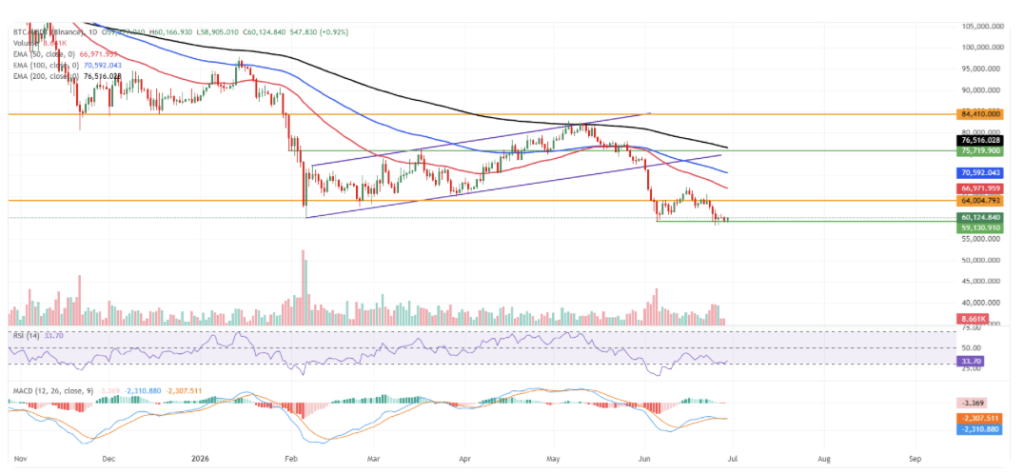
Bitcoin has recovered slightly after last week’s sharp correction, trading back above the $60,000 level. Still, the broader technical picture remains weak.
BTC continues to trade below its 50-day, 100-day and 200-day Exponential Moving Averages, which sit near $66,971, $70,592 and $76,516. That means the market structure is still tilted bearish, even with the latest bounce.
The MACD is hovering close to the zero line with a slightly negative reading, suggesting momentum remains fragile. Meanwhile, the RSI sits around 33, just above oversold territory. That could mean bearish pressure is starting to fade, but it does not yet confirm a clean reversal.
On the upside, Bitcoin faces its first major resistance near $64,004. After that, the 50-day EMA around $66,971 and the 100-day EMA near $70,591 could act as the next barriers. A stronger move would need to clear the 200-day EMA near $76,516 before traders could start talking seriously about a medium-term bullish shift.
Further above, the $84,410 area remains a wider resistance zone. Until Bitcoin clears these levels, rebounds may continue to look more like relief rallies than a real trend change.
Ethereum Holds Above Critical Support
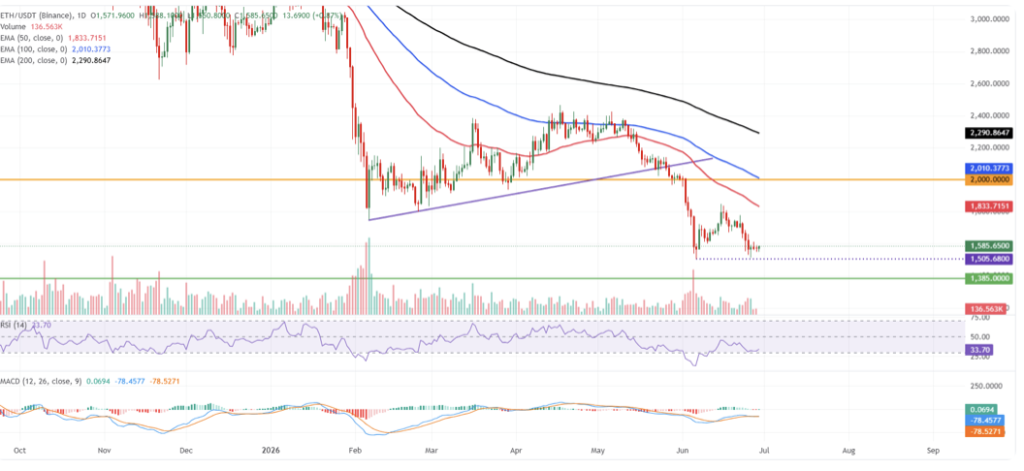
Ethereum is trading near $1,585, finding some stability above the crucial $1,500 support zone. That level has become one of the most important areas on the chart, and bulls are trying hard to defend it.
Like Bitcoin, Ethereum still carries a bearish bias. ETH remains below its 50-day, 100-day and 200-day EMAs at roughly $1,833, $2,010 and $2,290. These moving averages continue to limit recovery attempts and show that sellers still have control of the broader trend.
The RSI has ticked up to around 33, just above oversold levels. At the same time, the MACD has turned slightly positive, which may suggest downside momentum is weakening. But again, this is not a full bullish reversal yet, just a small sign that selling pressure is slowing.
If Ethereum pushes higher, the first major resistance sits near the 50-day EMA at $1,833. After that, the $2,000 horizontal barrier and the 100-day EMA near $2,010 come into focus. The 200-day EMA at $2,290 remains a larger ceiling for any stronger recovery.
On the downside, Ethereum must continue holding the $1,500 psychological level. If that breaks, the next support area sits near $1,385, where buyers may attempt to defend the medium-term structure.
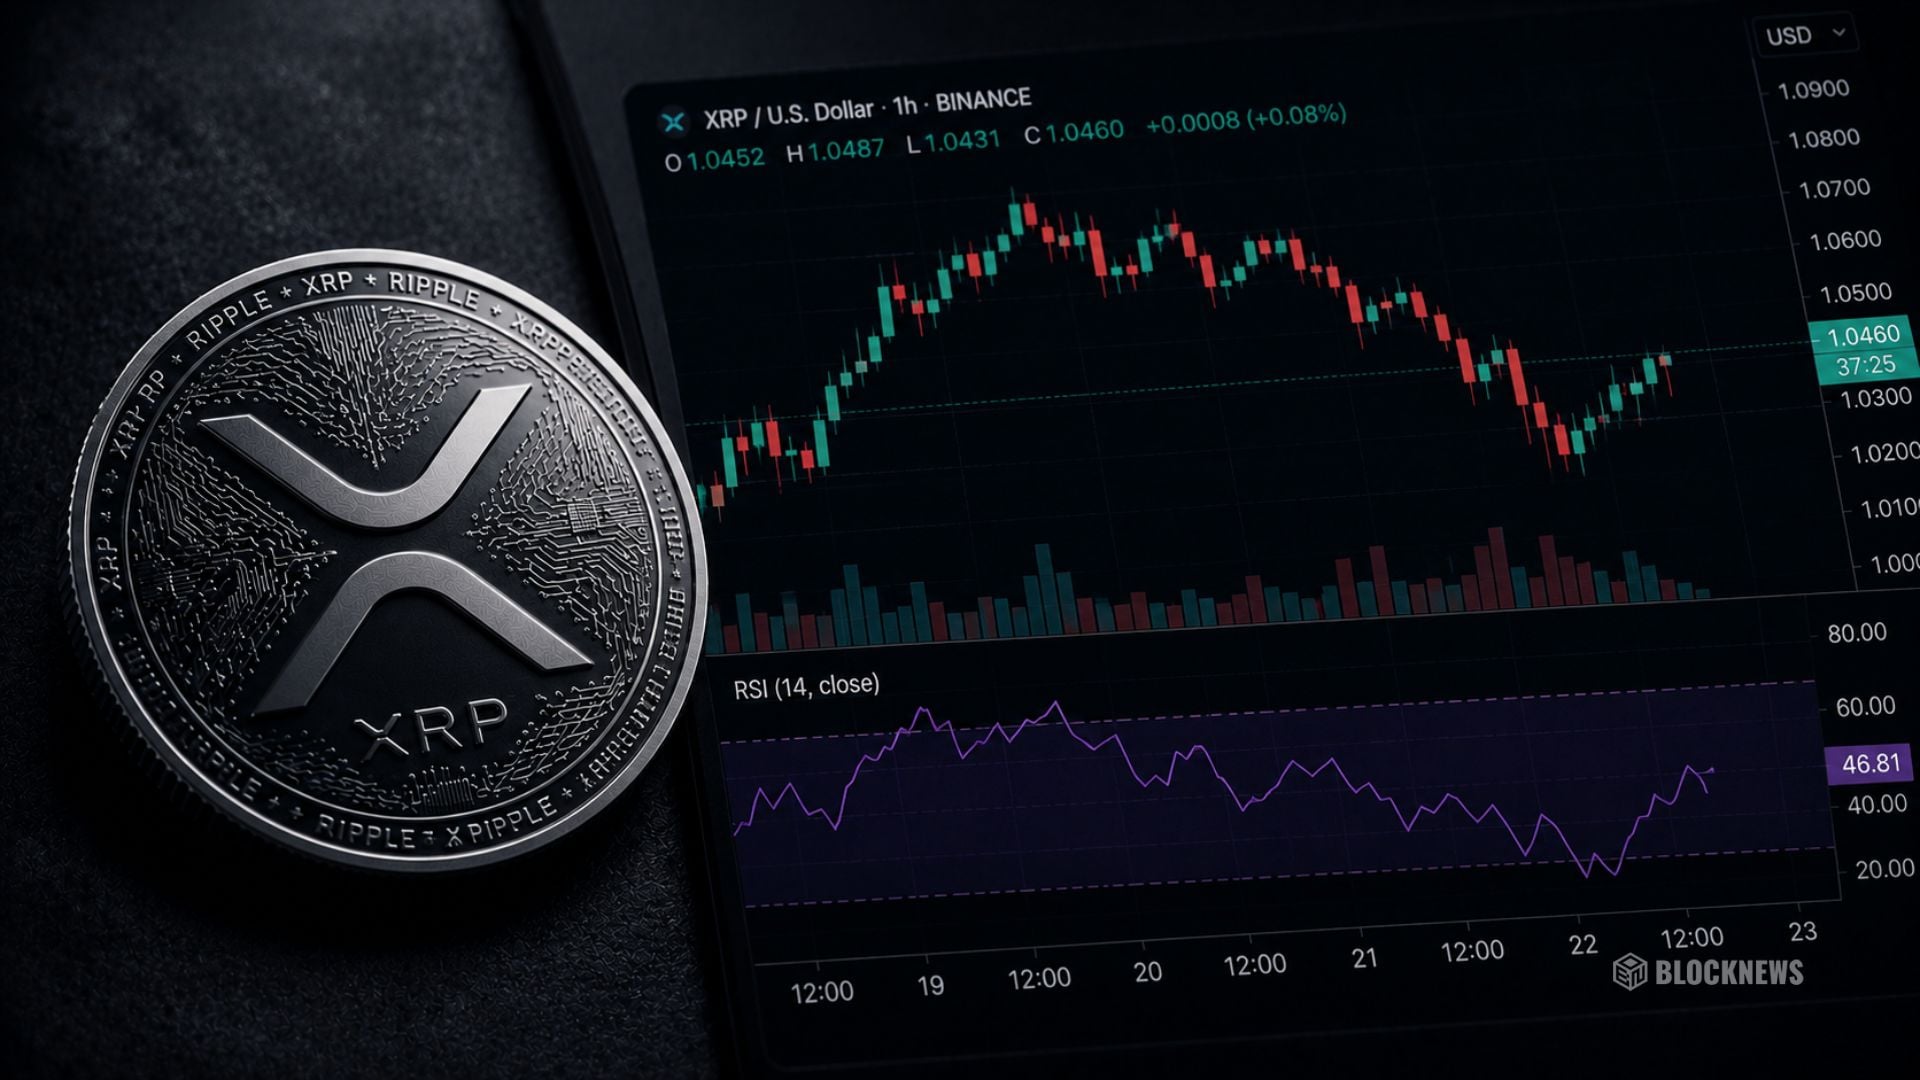
XRP Tries to Defend the $1 Level
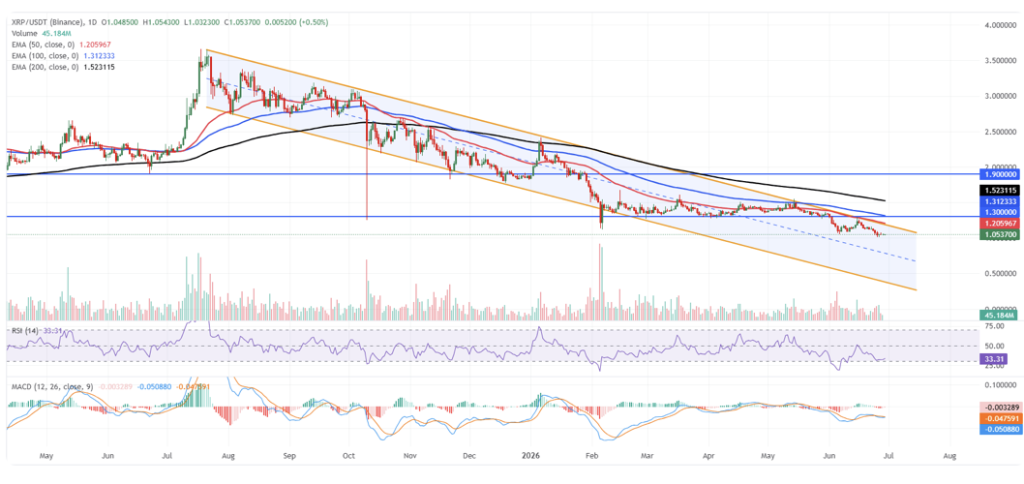
XRP is trading around $1.0542 and, much like the rest of the market, remains under technical pressure. The token is still below its 50-day, 100-day and 200-day EMAs at $1.2060, $1.3123 and $1.5231.
It also remains below the downward parallel channel level near $1.1879 and the horizontal cap around $1.3000. That keeps XRP’s structure technically capped for now.
The RSI sits near 33, showing weak momentum but also suggesting the token is not far from oversold territory. The MACD remains slightly negative, which means bears still have the edge, although selling pressure does not appear to be accelerating at the moment.
On the upside, XRP’s first resistance is near the parallel channel level at $1.1879. From there, the 50-day EMA near $1.2060 and the $1.3000 horizontal barrier become the next key levels to watch.
Additional resistance sits higher near the 100-day EMA at $1.3123 and the 200-day EMA at $1.5231. A much larger structural ceiling remains around $1.9000, but XRP would need a major shift in momentum before that level comes back into play.
For now, the most important support remains the $1.00 psychological level. If buyers can defend it, XRP may have room to build a short-term recovery. But if that level fails, the token could face another leg lower before fresh demand appears.
Disclaimer: BlockNews provides independent reporting on crypto, blockchain, and digital finance. All content is for informational purposes only and does not constitute financial advice. Readers should do their own research before making investment decisions. Some articles may use AI tools to assist in drafting, but every piece is reviewed and edited by our editorial team of experienced crypto writers and analysts before publication.


 English (US) ·