
 3 hours ago
12
3 hours ago
12
- Solana is showing signs of recovery as bullish derivatives data and strong on-chain activity boost market sentiment.
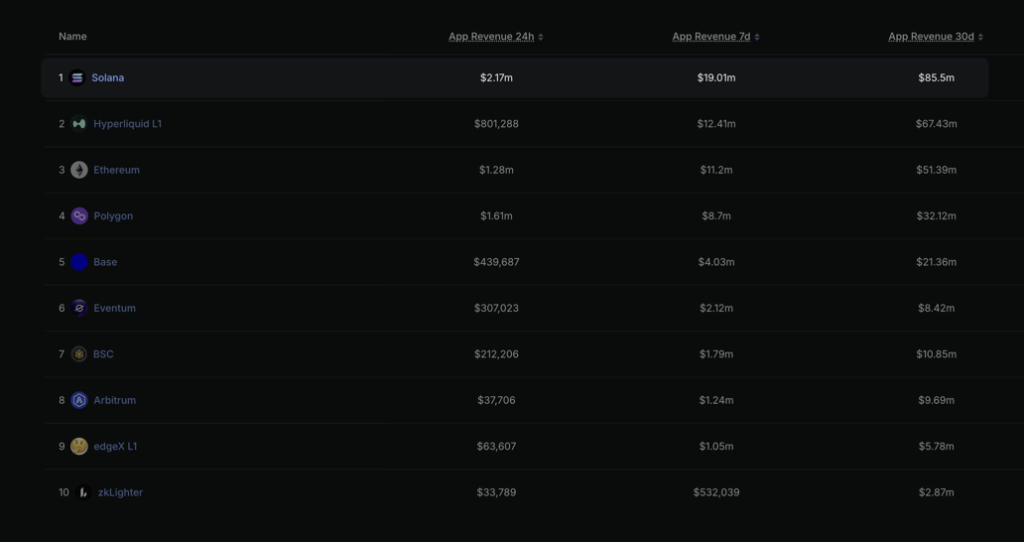
- The network continues to outperform Ethereum and Hyperliquid in application revenue, highlighting growing ecosystem strength.
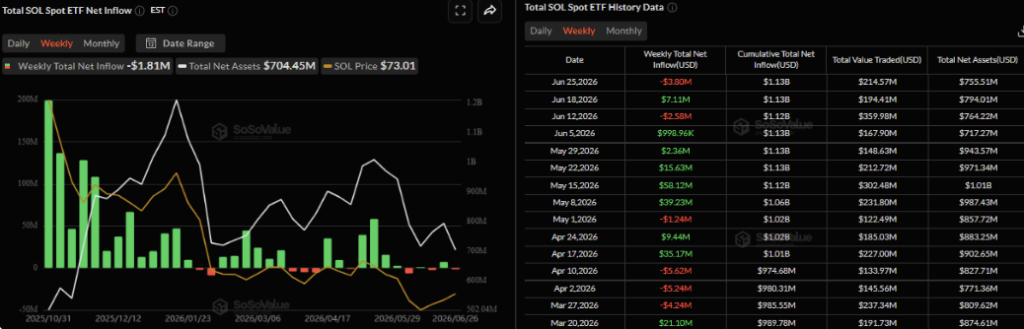
- Despite the positive outlook, continued spot ETF outflows suggest institutional investors remain cautious.
Solana is beginning to regain some momentum after a volatile stretch that pushed prices sharply lower. The cryptocurrency is trading back above $71 after posting only a modest decline last week, giving traders fresh hope that the recent correction may finally be easing.
The recovery isn’t being driven by price action alone.
Several market indicators are beginning to lean bullish, from improving derivatives data to impressive growth across Solana’s on-chain economy. Still, one notable concern remains. Institutional investors continue pulling money from spot Solana ETFs, a trend that could limit how far any short-term rally can extend.
Derivatives Traders Turn More Optimistic
Sentiment in Solana’s derivatives market has noticeably improved over the past few days.
According to CoinGlass, SOL’s funding rate turned positive last Thursday and climbed to around 0.0073% on Monday. A positive funding rate means traders holding long positions are paying those betting against the asset, which generally reflects growing confidence that prices could move higher.
Another encouraging signal comes from the long-to-short ratio.
That metric has risen to 1.06, moving back above the important threshold of one. Whenever the ratio exceeds one, it suggests more traders are positioning for gains than additional downside.
While neither indicator guarantees a rally, together they paint a much healthier picture than what Solana’s derivatives market was showing just a week ago.
Solana Outpaces Every Major Blockchain in Revenue
Beyond trading activity, Solana’s blockchain continues to deliver some of the strongest fundamental numbers in the industry.
Recent data shows the network generated approximately $2.17 million in application revenue over the past day, $19.01 million during the week, and an impressive $85.5 million over the past month.
Those figures place Solana comfortably ahead of every other blockchain, including Ethereum and Hyperliquid.
Strong application revenue typically reflects healthy user activity, increasing transaction volume, and developers building products that people actually use. All of those factors strengthen the long-term investment case for SOL and suggest that the ecosystem remains one of the busiest in crypto despite recent market volatility.
ETF Outflows Remain a Warning Sign
Not everything is moving in Solana’s favor, however.
Institutional demand continues to lag behind retail sentiment.
According to data from SoSoValue, spot Solana ETFs recorded roughly $3.8 million in net outflows last week. While that figure isn’t particularly large compared to Bitcoin or Ethereum ETFs, it still signals that larger investors remain cautious.
If those outflows continue or accelerate in the coming days, they could create additional selling pressure and slow any meaningful recovery.
For now, improving derivatives data and weakening institutional demand are telling two very different stories, making Solana’s next move less straightforward than it may first appear.
Solana Faces Heavy Resistance Despite Improving Momentum
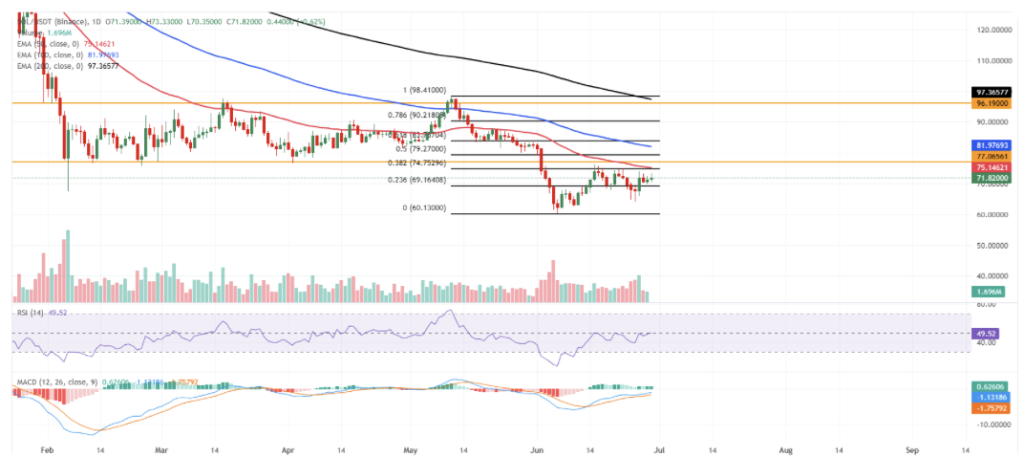
Solana is currently trading around $71.82 as buyers attempt to extend the latest rebound.
Even so, the broader technical trend remains cautious.
SOL still trades below its 50-day, 100-day and 200-day Exponential Moving Averages at approximately $75.14, $81.97 and $97.36. Those moving averages continue acting as overhead resistance and suggest the market hasn’t fully escaped its bearish structure.
Another important hurdle sits near the 38.2% Fibonacci retracement level around $74.75, just ahead of the 50-day EMA.
Momentum indicators are beginning to improve, though.
The Relative Strength Index has climbed back toward the neutral 50 level, while the MACD has crossed into positive territory, hinting that bearish momentum is fading. That said, neither indicator has produced a decisive breakout signal yet.
If buyers continue gaining control, Solana’s first resistance lies around $74.75, followed closely by the 50-day EMA near $75.14 and the horizontal resistance around $77.07.
A successful break above those levels would shift attention toward the 50% Fibonacci retracement near $79.27, the 100-day EMA around $81.98, and eventually the next resistance area close to $83.79.
On the downside, immediate support sits near the 23.6% Fibonacci retracement at $69.16. Below that, the next major structural support remains around the cycle low near $60.13.
As long as Solana continues defending those lower levels while on-chain activity stays strong, traders will likely continue watching for signs that a broader recovery is beginning to take shape.
Disclaimer: BlockNews provides independent reporting on crypto, blockchain, and digital finance. All content is for informational purposes only and does not constitute financial advice. Readers should do their own research before making investment decisions. Some articles may use AI tools to assist in drafting, but every piece is reviewed and edited by our editorial team of experienced crypto writers and analysts before publication.


 English (US) ·