
 2 hours ago
25
2 hours ago
25

CoreWeave stock is caught in a downtrend on the daily chart, yet short-term price action is showing early signs of recovery. As CRWV approaches its 2Q26 earnings report in early August, the market faces a dual narrative: bearish structure versus a modest intraday bounce.
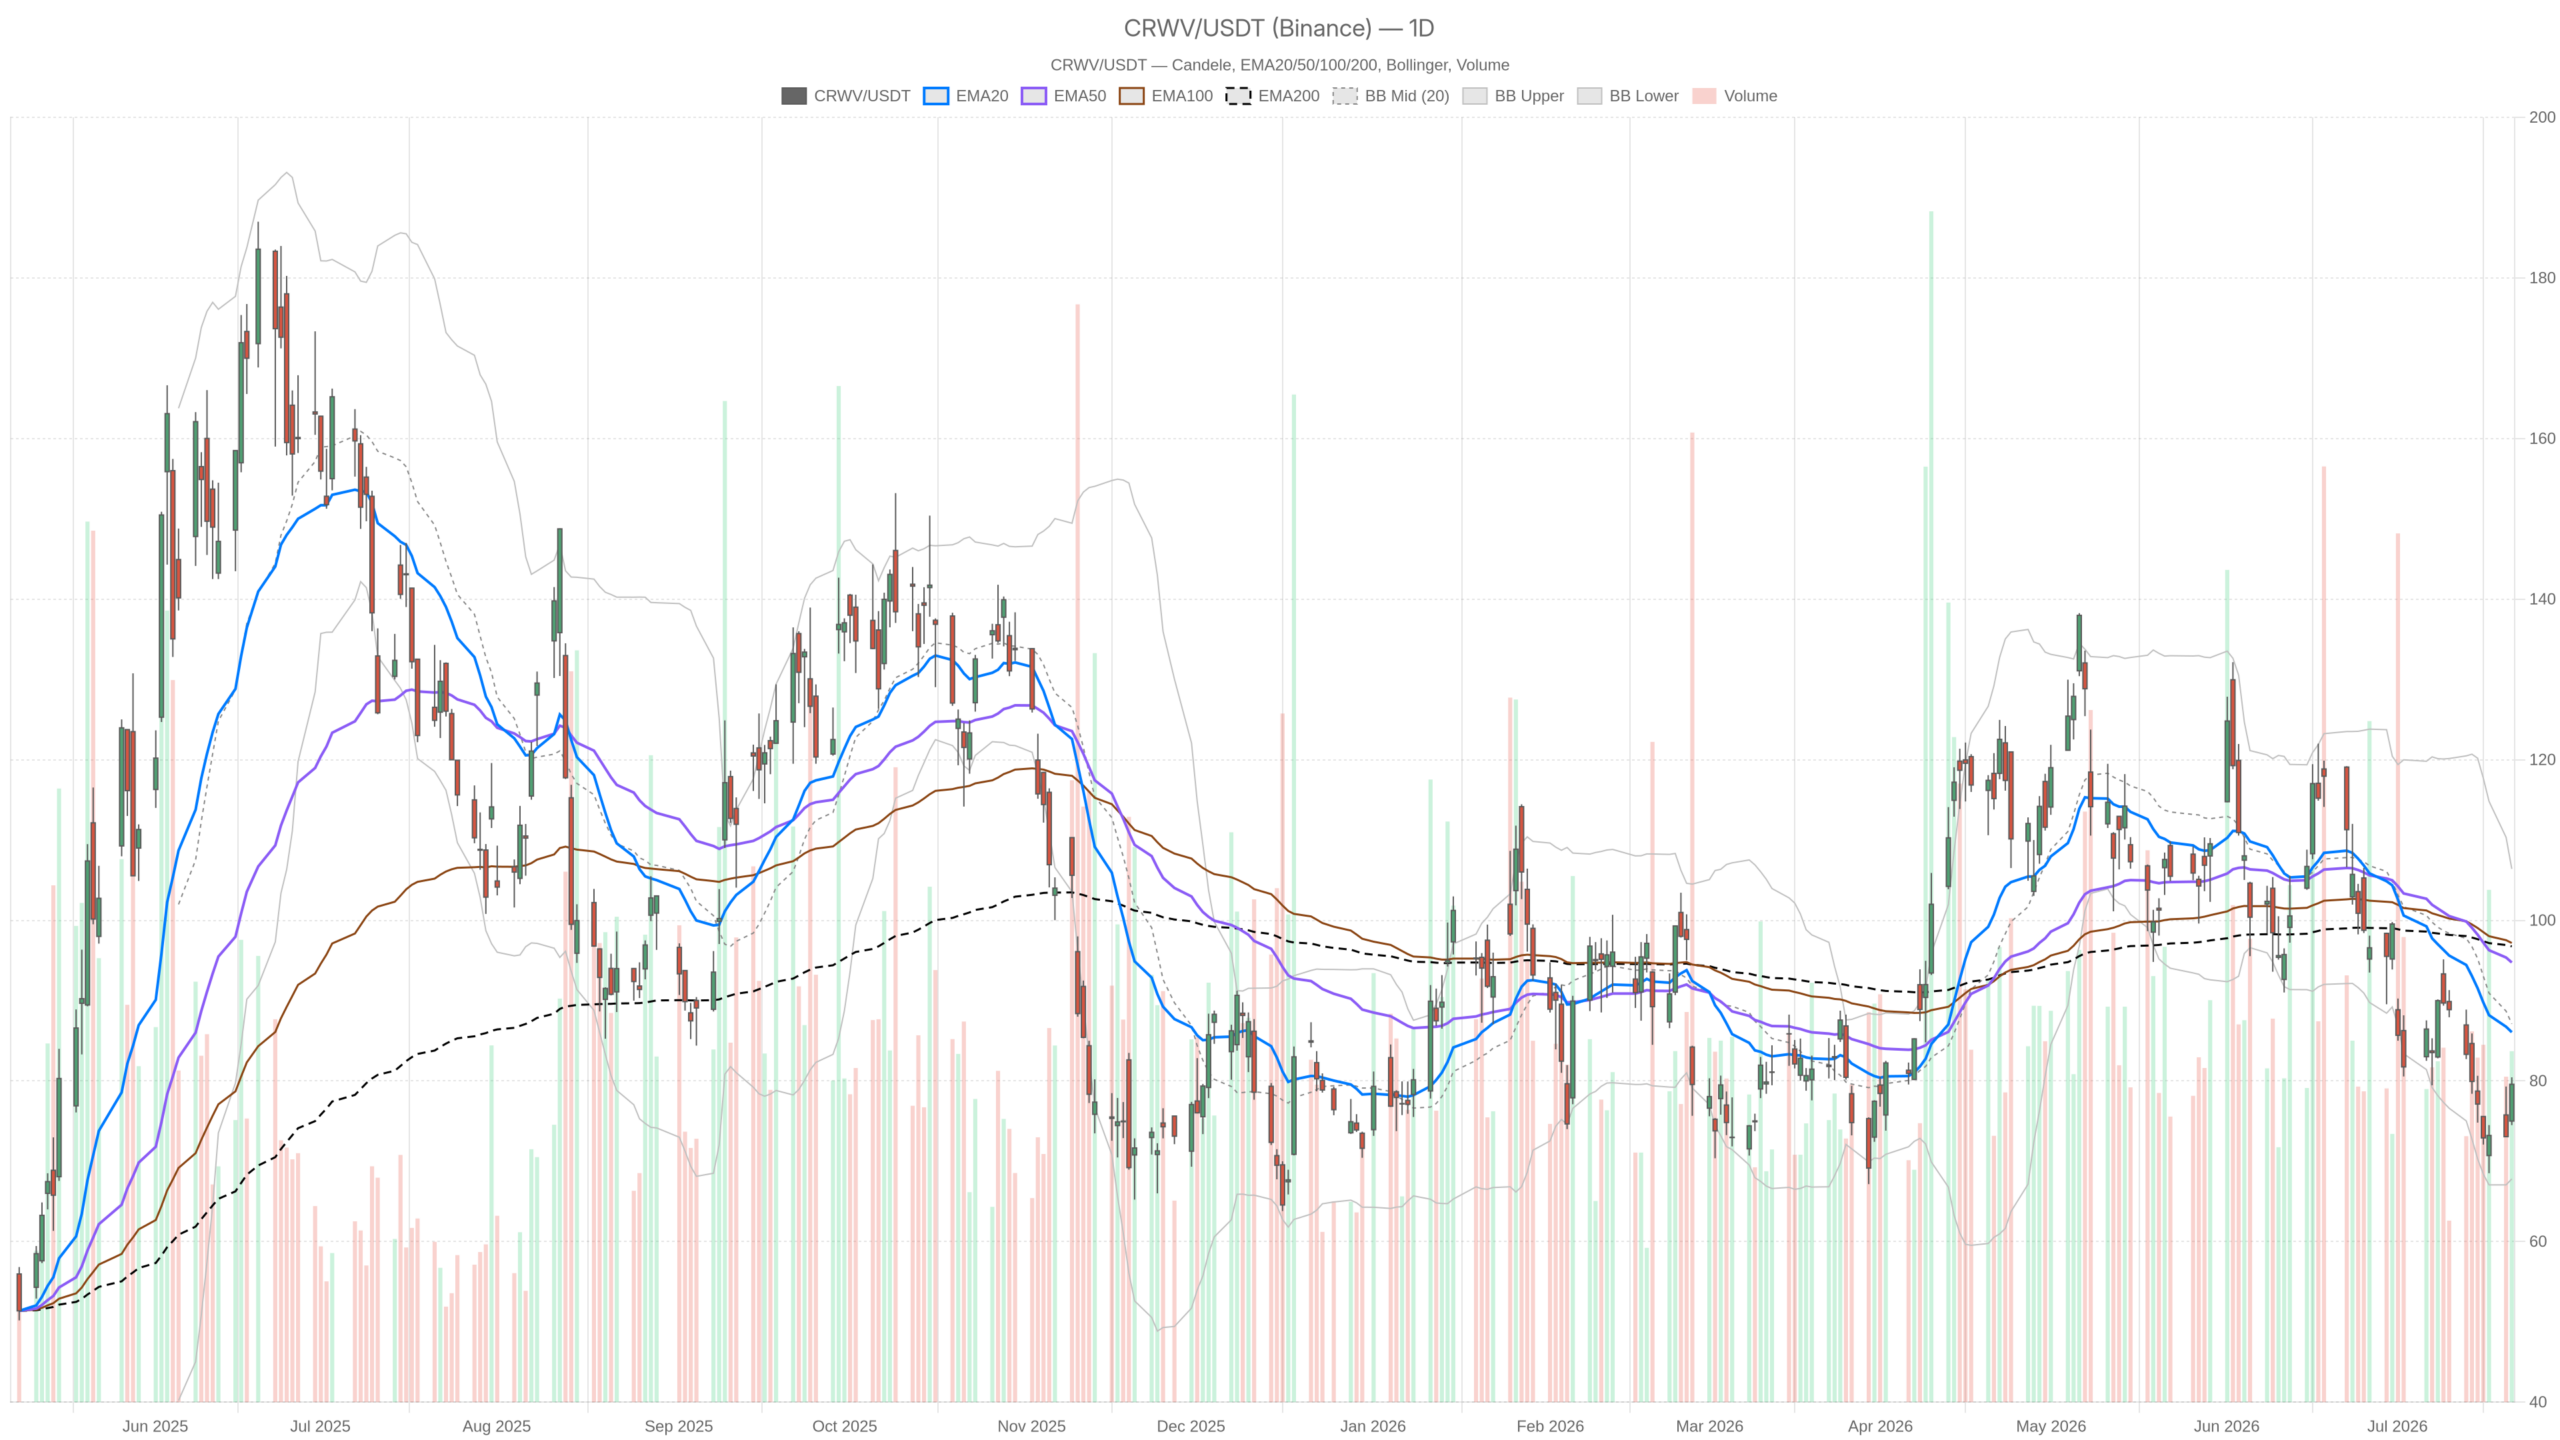 CRWV — daily chart with candlesticks, EMA20/EMA50 and volume.
Key takeaways
- CRWV closed at $79.58 on July 21, below all three daily EMAs.
- The daily MACD histogram at -0.82 confirms bearish momentum is not yet exhausted.
- The 1H chart shows a recovery with price above the EMA20 and EMA50 and RSI at 60.
- The $80.10–$80.61 resistance cluster is the key short-term test for bulls.
- A daily ATR of $6.83 signals elevated volatility heading into earnings.
Daily Timeframe: CoreWeave Stock Remains in a Bearish Regime
CoreWeave stock is firmly bearish on the daily chart, trading well below all three key exponential moving averages. CRWV closed at $79.58 on July 21, with a session range between $74.50 and $80.45. That close sits beneath the EMA20 at $86.07, the EMA50 at $94.75, and the EMA200 at $96.75. A stacked bearish EMA structure like this signals the dominant trend remains firmly to the downside.
The daily MACD reinforces that reading. Its line sits at -7.52, the signal at -6.70, and the histogram at -0.82. The negative histogram is widening slightly, indicating bearish momentum has not yet exhausted itself. Meanwhile, the RSI14 at 40.27 is approaching oversold territory without actually reaching it.
Meanwhile, Bollinger Bands on the daily frame show the midline at $87.11 and the lower band at $67.80. CRWV is trading in the lower half of this range, consistent with the bearish regime. The daily ATR of $6.83 signals that volatility remains elevated. Single-session swings of that magnitude should be expected, making conviction calls more difficult ahead of earnings. The daily pivot sits at $78.18, with R1 at $81.85 and S1 at $75.90. Tuesday’s close holds marginally above the pivot, but the structure remains fragile.
Hourly and 15-Minute Context: A Short-Term Bounce in Progress
The 1H chart tells a different story — a short-term recovery is gaining traction above the EMA20 and EMA50. The hourly close at $79.58 sits above both the 1H EMA20 ($76.77) and EMA50 ($78.37). This marks a meaningful shift in near-term structure. At the same time, the 1H RSI at 60 reflects building momentum without being stretched. The 1H MACD tells the same story: its line at 0.60 has crossed above the signal at -0.18, producing a positive histogram of 0.78. That crossover is a concrete sign of short-term momentum turning higher.
However, the 1H EMA200 at $89.31 remains deeply overhead, reminding traders the broader trend is still negative. The 1H Bollinger upper band at $80.61 sits just above the current price, acting as immediate resistance. The 1H pivot at $79.13 with R1 at $80.10 aligns closely with that Bollinger ceiling. In short, CoreWeave stock is pushing against a cluster of resistance right here.
On the 15-minute chart, the regime is also neutral. Price closed at $79.58, with MACD showing a slight bearish divergence — the histogram at -0.19 after recent positive readings. The 15m RSI at 63.81 is elevated, hinting at near-term exhaustion after the intraday push. This is not a reversal signal in isolation, but it cautions against chasing the move at current levels.
The Bullish Scenario: What Would Support a Recovery
A credible recovery requires CRWV to clear and hold above $80.61 and then challenge daily R1 at $81.85. A sustained break above that level would begin to neutralize the bearish daily structure, at least in the near term. The fundamental backdrop could provide the catalyst. Demand for GPU cloud services remains strong, according to market commentary ahead of the 2Q26 report. Bank of America has reiterated a Buy rating on CoreWeave stock, citing the AI demand outlook.
If the upcoming earnings report demonstrates that CoreWeave can bring new power capacity online efficiently, sentiment could shift rapidly. A print confirming execution — particularly around data center activation timelines — would be the most meaningful positive trigger.
The Bearish Scenario: What Would Invalidate the Rally
The rally fails if CRWV cannot hold the $78.61 support, which would quickly expose daily S1 at $75.90. The daily EMA structure remains deeply hostile, with the EMA20, EMA50, and EMA200 all stacked above current price. Below $75.90, the lower Bollinger Band at $67.80 represents a realistic downside target if selling resumes.
Broadly, Seeking Alpha commentary noted that CRWV had already fallen 27% from earlier levels while still being rated a Hold. The selloff has been meaningful, but the valuation argument is not yet compelling enough to attract aggressive buyers. Persistent capex concerns — specifically, how fast the company can activate new power infrastructure — remain a genuine risk heading into earnings.
Positioning and Volatility Outlook for CRWV
CoreWeave stock presents a classic pre-earnings tension: a bearish daily chart offset by a short-term recovery that the market still needs to validate. The daily ATR of $6.83 alone implies that significant single-session moves in either direction are well within normal range. Traders watching the $80.10–$80.61 resistance cluster have a clear short-term test to monitor. A clean hold above that zone would shift the near-term narrative.
Conversely, a rejection there would simply reinforce the dominant daily trend. With 2Q26 earnings approaching and execution risk still present, uncertainty is elevated on both sides of the trade. This is not an environment that rewards overconfidence in either direction.
FAQ
Is CoreWeave stock in a downtrend?
Yes. CRWV trades below all three daily EMAs — the EMA20 at $86.07, EMA50 at $94.75, and EMA200 at $96.75 — with a negative MACD histogram confirming bearish momentum.
What is the key resistance level for CoreWeave stock?
The $80.10–$80.61 cluster, where the 1H pivot R1 and the 1H Bollinger upper band converge. A clean break above this zone is needed for the recovery to gain credibility.
When is CoreWeave’s next earnings report?
The 2Q26 earnings report is expected in early August. Bank of America has reiterated a Buy rating ahead of the release, citing AI-driven demand.
What is the downside risk for CRWV?
If selling resumes, the lower daily Bollinger Band at $67.80 represents a realistic downside target. The daily S1 pivot at $75.90 would be the first support to watch on the way down.
Disclaimer: This article is for informational purposes only and does not constitute financial advice, an investment recommendation, or a solicitation to buy or sell any financial instrument or cryptocurrency. The analysis provided is not indicative of future results. Investing in crypto assets and financial markets carries a high risk of capital loss. Always do your own research (DYOR) and consult a qualified financial advisor before making any decision.
Article produced with the assistance of artificial intelligence and reviewed by the editorial team.






 English (US) ·