
 2 hours ago
22
2 hours ago
22

Dell Technologies Inc. stock plunged 14% intraday on July 15 as a broad AI hardware selloff swept the sector. HPE, Super Micro Computer, Micron, and SanDisk all tumbled — but Dell led the carnage. The pivotal question now: structural breakdown or an overextended shakeout in an otherwise intact trend?
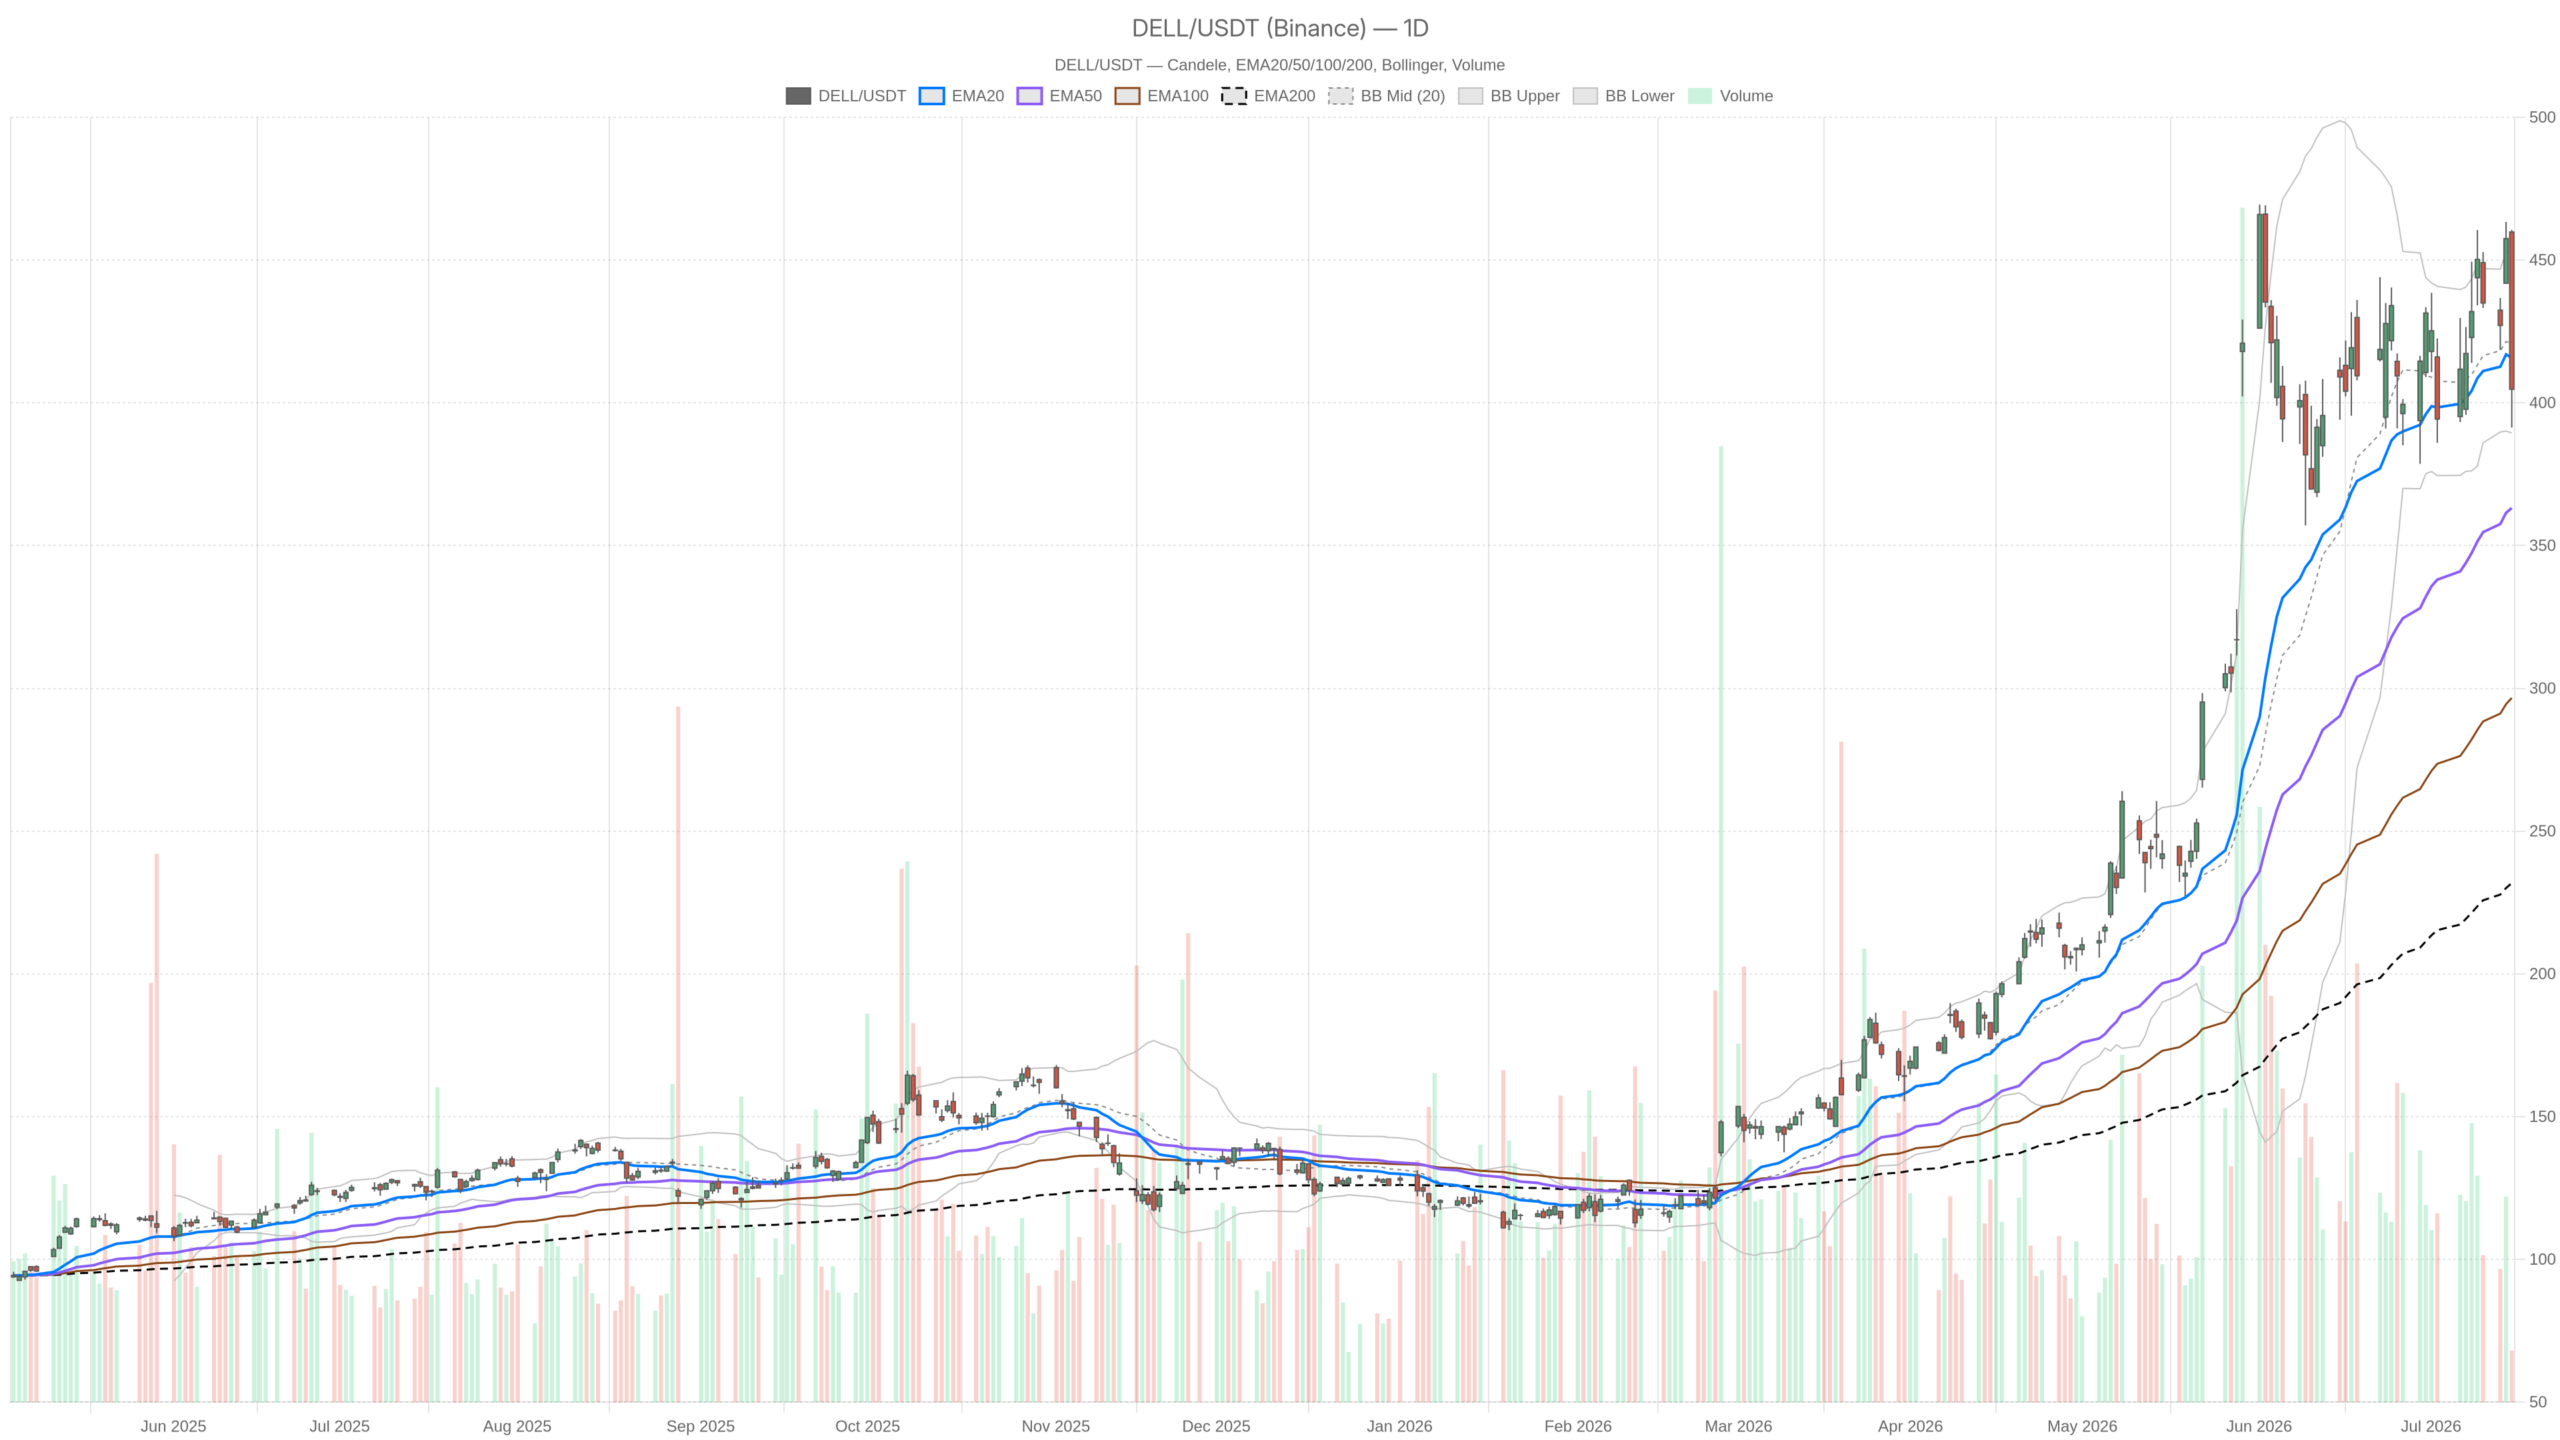 DELL — daily chart with candlesticks, EMA20/EMA50 and volume.
Key takeaways
- Dell Technologies Inc. stock closed at $404.79 on July 15, firmly below its 20-day EMA of $415.79.
- A fresh daily MACD bearish crossover emerged, with the histogram printing -4.23.
- The intraday range hit nearly $70, more than double the daily ATR of $33.64.
- Long-term EMA structure remains intact — the 50-day EMA at $363.18 and 200-day EMA at $231.80.
- Evercore ISI flagged memory pricing concerns on July 15, compounding the AI hardware selloff pressure.
Dell Technologies Inc. Stock Daily Chart: Structural Damage Assessed
Dell Technologies Inc. stock suffered meaningful technical damage on July 15, yet the long-term trend structure has not been destroyed. The close at $404.79 pushed the stock below its 20-day EMA, but the 50-day and 200-day EMAs remain far below — leaving the macro uptrend intact for now.
On balance, the daily picture still holds some structural support. However, the margin for error is narrowing fast. The close at $404.79 pushed Dell firmly below its 20-day EMA at $415.79. That level now shifts from support to resistance. Meanwhile, the daily regime is flagging neutral, not outright bearish — a meaningful nuance when assessing recovery potential.
Price Action and Volatility Context
The daily candle tells a harsh story. Dell opened at $459.82 and reached a session high of $460.56. It then collapsed to a low of $391.33 before recovering to close at $404.79. That is an intraday range of nearly $70. The daily ATR of $33.64 confirms extreme volatility. Notably, one session printed more than two average daily ranges.
Despite the severity of the drop, the daily EMA structure remains constructive over the longer frame. The 50-day EMA sits at $363.18 and the 200-day EMA at $231.80. Both are well below current price. Therefore, the macro trend has not been destroyed in a single session. Still, the close well beneath the Bollinger Band midline of $421.19 signals that near-term momentum has decisively flipped negative.
Meanwhile, the lower Bollinger Band sits at $389.49. Dell briefly breached it intraday before recovering above it into the close. That intraday wick below the band is a volatility signal, not necessarily a capitulation. Traders will watch whether price can reclaim the midline — currently at $421.19 — in the coming sessions. Failure to do so would reinforce a bearish near-term read.
Momentum Indicators Signal Caution
Daily RSI at 50.05 is almost precisely neutral. It neither confirms a collapse nor a healthy continuation. The MACD, however, is more revealing. The line at 18.63 has crossed below the signal line at 22.86. The histogram prints a negative reading of -4.23. This fresh bearish crossover on the daily chart typically precedes further softness if unresolved quickly.
The pivot point at $418.89 now acts as the first meaningful overhead barrier. R1 at $446.45 serves as a secondary resistance zone. Meanwhile, S1 at $377.22 is the key downside level to watch in the sessions ahead.
Hourly Signals Reinforce the Selling Pressure
The hourly chart confirms sellers remain firmly in control of Dell Technologies Inc. stock. Price trades below both the 20-hour and 50-hour EMAs. Only the 200-hour EMA at $403.32 provides any near-term floor for the stock.
The hourly close at $404.79 sits meaningfully below the 20-hour EMA at $426.04 and the 50-hour EMA at $428.69. That dual EMA rejection confirms sellers are in control of the intermediate structure. The only encouraging signal is price trading fractionally above the 200-hour EMA at $403.32. That level is acting as a short-term floor.
At the same time, hourly RSI at 37.66 approaches oversold territory without having reached it yet. That leaves room for additional downside before a technical bounce becomes statistically likely. The MACD paints a clear picture: the line at -8.10 is falling well below the signal at -2.74, with the histogram at -5.36. Momentum on the hourly frame is deteriorating, not stabilizing.
Momentum Conflict and Pivot Battleground
In contrast to the daily RSI sitting at neutral, the hourly momentum indicators are actively bearish. This conflict complicates any near-term recovery thesis. The hourly Bollinger Band midline at $430.34 sits far above current price. This confirms Dell is trading in the lower half of its recent range. The hourly ATR at $13.48 reflects elevated intraday volatility — conditions that tend to produce sharp swings in both directions.
The hourly pivot cluster at $405.34 (PP), $406.84 (R1), and $403.28 (S1) defines the immediate battleground. The range is tight, reflecting the compression between support and resistance on the hourly frame.
15-Minute Frame: Bearish Regime, Early Stabilization Hints
The 15-minute chart shows an explicitly bearish regime in Dell Technologies Inc. stock. However, the very first signs of short-term momentum exhaustion are emerging near the close. These early signals do not constitute a reversal, but they merit close attention.
Price trades below the 20-period EMA at $409.81, the 50-period EMA at $423.73, and the 200-period EMA at $428.73. This is a full EMA stack pointing downward — pure execution-context confirmation that short-term sellers dominated throughout the session.
Notably, the 15-minute MACD histogram at +1.94 provides the first small flicker of positive divergence. The line remains negative at -9.40, still below the signal at -11.35. Yet the histogram turning positive suggests very short-term downside momentum is losing intensity. This is not a buy signal. It does, however, indicate the most aggressive leg of selling may be temporarily exhausted.
The 15-minute RSI at 38 corroborates this reading. It sits in oversold-adjacent territory without triggering a full reversal signal. Combined with the ATR at $5.86, the 15-minute picture points to a stock bleeding slowly into the close — not accelerating into a panic flush.
The Narrative Behind the Numbers: AI Trade Meets Gravity
The fundamental context behind the Dell Technologies Inc. stock selloff matters as much as the technical signals. Analysts at Evercore ISI reiterated their Dell rating on July 15, flagging memory pricing concerns as a key risk. That institutional note landed on an already fragile tape. The broader AI hardware selloff took down Dell, HPE, Super Micro, Micron, and SanDisk simultaneously. It reflects mounting concern about whether AI infrastructure demand can justify current valuations after the months-long rally.
Meanwhile, one market narrative frames the selloff as crowded positioning rather than a crack in the underlying AI demand story. That distinction matters enormously for how Dell stock trades over the next several sessions. Dell’s role as a leading AI server provider has been central to its multi-month rally. The 200-day EMA at $231.80 — still far below current price — reflects just how powerful that structural re-rating has been. A single-day 14% decline, however violent, does not erase a sustained fundamental tailwind. It does, however, reset the near-term risk-reward calculus.
Bullish Scenario: Reclaiming Key Levels Would Restore Confidence
For bulls to reassert control over Dell Technologies Inc. stock, two levels must be reclaimed. First, price needs to recover above the daily pivot point at $418.89. Second, it must close back above the 20-day EMA at $415.79 on strong volume. A sustained hold above both levels would suggest the session was a sentiment-driven overreaction — the kind of shakeout that often precedes trend resumption.
Furthermore, above $446.45 (R1), the bullish thesis would regain full credibility. The intact long-term EMA structure and the still-neutral daily RSI both leave the door open for such a scenario. The recovery path exists, but it requires confirmation in the next two to three sessions.
Bearish Scenario: S1 and Lower Band Define the Downside Path
On the other hand, if Dell Technologies Inc. stock fails to reclaim the $415.79–$418.89 zone, downside risks accelerate. A deepening daily MACD divergence would add conviction to the bearish case. The next meaningful support sits at the daily S1 of $377.22. Below that, the lower Bollinger Band at $389.49 — already tested intraday — would likely offer no durable floor.
The hourly MACD remaining deep in negative territory would confirm this trajectory. Continued deterioration in memory pricing sentiment, as flagged by Evercore ISI, could serve as the catalyst that keeps sellers engaged. In that scenario, the 50-day EMA at $363.18 becomes the primary downside target for Dell stock.
Positioning in a High-Volatility Environment
Dell Technologies Inc. stock sits at a genuine inflection point. The daily structure has not broken down irreparably, but meaningful technical damage was inflicted in a single session. The hourly and 15-minute frames confirm near-term selling dominance. At the same time, the shortest-term momentum hints at stabilization. Volatility remains extreme — a daily ATR of $33.64 demands wide stops and careful sizing for anyone attempting to trade the recovery.
Overall, the most prudent read is cautious. The next two to three sessions will be decisive. They will determine whether this was a healthy correction or the beginning of a more sustained reversal in Dell’s AI-driven rally.
FAQ
What caused Dell Technologies Inc. stock to drop 14% on July 15?
A broad AI hardware selloff swept the sector on July 15, hitting Dell alongside HPE, Super Micro Computer, Micron, and SanDisk. The move was compounded by an Evercore ISI analyst note flagging memory pricing concerns as a key risk for Dell specifically.
Is Dell’s long-term uptrend still intact after the selloff?
Yes, the long-term EMA structure remains intact. The 50-day EMA at $363.18 and the 200-day EMA at $231.80 are both well below the closing price of $404.79. However, the breach of the 20-day EMA and the fresh daily MACD bearish crossover warrant caution in the near term.
What are the key support levels to watch for Dell stock?
The immediate support is the 200-hour EMA at $403.32 and the hourly S1 at $403.28. Below that, the daily S1 at $377.22 is the next major level. The lower daily Bollinger Band at $389.49 was already tested intraday. The 50-day EMA at $363.18 represents the deeper structural support.
What would signal a recovery in Dell Technologies Inc. stock?
A recovery would require Dell to reclaim the daily pivot point at $418.89 and close back above the 20-day EMA at $415.79 on strong volume. A sustained move above $446.45 (R1) would fully restore the bullish thesis.
Disclaimer: This article is for informational purposes only and does not constitute financial advice, an investment recommendation, or a solicitation to buy or sell any financial instrument or cryptocurrency. The analysis provided is not indicative of future results. Investing in crypto assets and financial markets carries a high risk of capital loss. Always do your own research (DYOR) and consult a qualified financial advisor before making any decision.
Article produced with the assistance of artificial intelligence and reviewed by the editorial team.







 English (US) ·