
 1 hour ago
19
1 hour ago
19
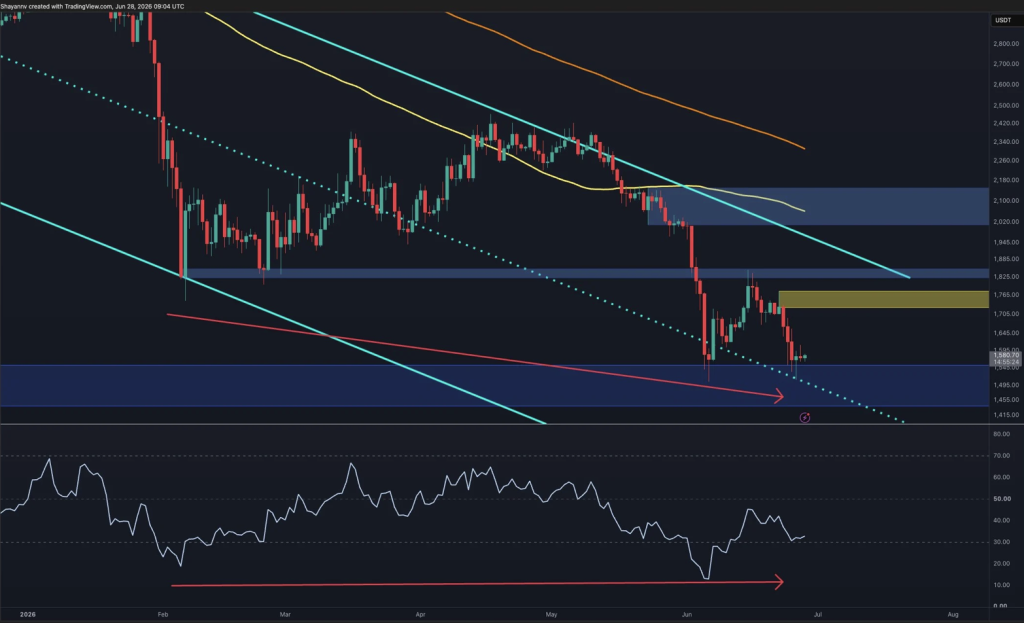
- Ethereum is still trading in a broader downtrend, but technical indicators suggest selling pressure may be starting to weaken.
- A bullish RSI divergence is developing while ETH continues holding a major support zone between $1.46K and $1.53K.
- Liquidity remains stacked above current prices, raising the possibility of a short-term rally toward the $1.72K-$1.80K region.
Ethereum continues to trade under heavy pressure across higher timeframes, yet there are early hints that the relentless selling may finally be running out of steam. The overall trend hasn’t flipped bullish, not even close, but recent price action suggests bears aren’t dominating the market quite as easily as they were a few weeks ago.
Momentum is shifting… slowly. And while that doesn’t guarantee a reversal, it’s enough to keep traders watching closely.
Daily Chart Signals Momentum Is Improving
After failing to break through the $1.72K-$1.78K resistance zone, Ethereum slipped back into the key $1.46K-$1.53K support area. This region has repeatedly attracted buyers throughout June, making it one of the most important levels on the chart.
The bigger story, though, is happening beneath the surface.
The Relative Strength Index (RSI) has formed a bullish divergence. Even as ETH continued printing lower lows, the RSI quietly posted higher lows while hovering near oversold levels. That kind of setup often appears toward the end of extended bearish trends, hinting that selling momentum is beginning to fade.
Of course, a bullish divergence by itself doesn’t confirm a reversal. It simply suggests conditions are improving.
As long as Ethereum stays above the $1.46K-$1.53K support range, the divergence remains valid and keeps the door open for a relief rally. To fully confirm that scenario, however, buyers still need to reclaim the major resistance zone around $1.72K-$1.78K.
Until that happens, the broader market structure remains bearish.
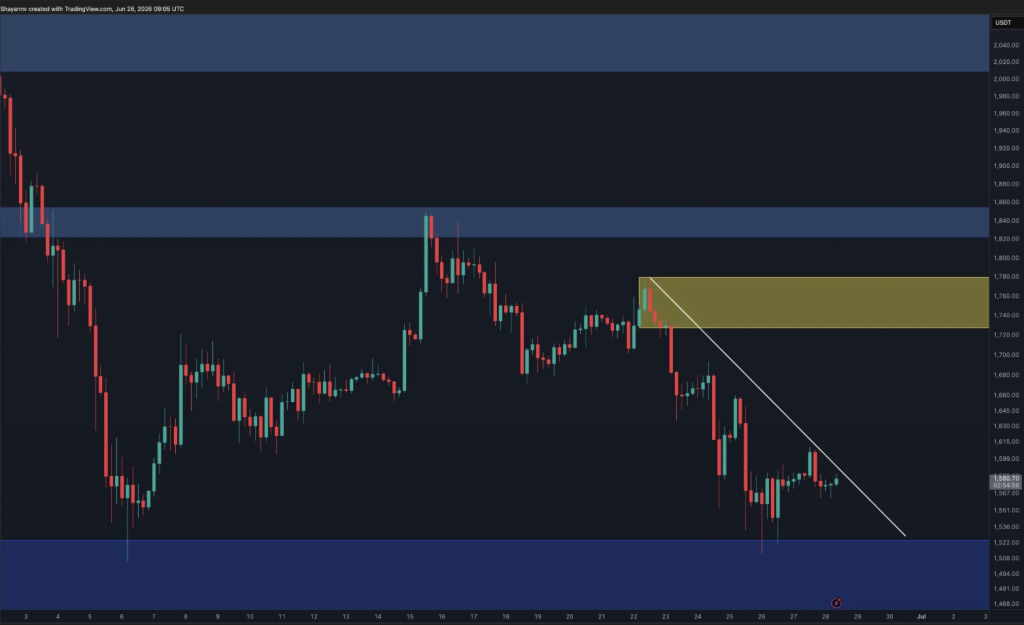
4-Hour Chart Shows Breakout Potential
Zooming into the 4-hour timeframe paints a slightly more encouraging picture.
Ethereum has spent the past several sessions consolidating just above support after its sharp rejection in late June. At the same time, a descending trendline has capped every recovery attempt since that selloff.
Now, price is compressing directly beneath that trendline while volatility continues to tighten.
This type of setup often leads to a decisive move.
If buyers manage to push ETH above the descending resistance, the next logical target sits back at the $1.72K-$1.78K supply zone, where the previous decline began. Such a move would also line up with the bullish RSI divergence visible on the daily chart and could spark Ethereum’s strongest recovery in weeks.
On the flip side, the $1.52K level remains critical. Losing that support would invalidate the short-term bullish outlook and likely send ETH back into the broader downtrend.
For now, Ethereum remains squeezed between support below and resistance above, waiting for the market to choose a direction.
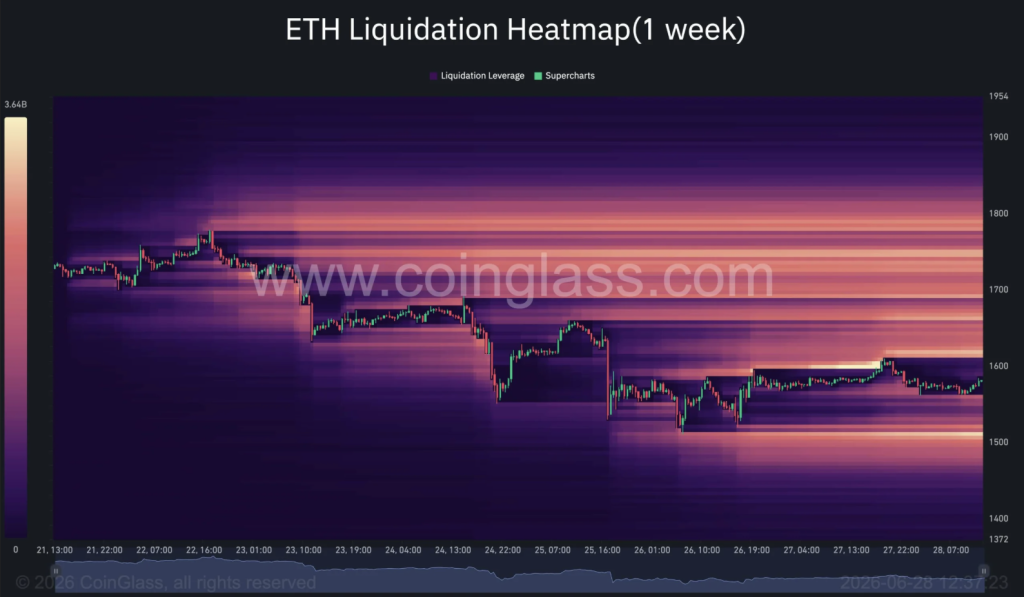
Liquidity Could Fuel the Next Move
Liquidation data adds another interesting layer to the picture.
Large clusters of liquidity remain parked above Ethereum’s current price, particularly between roughly $1.68K and $1.80K. Markets frequently gravitate toward these highly leveraged areas, making them attractive short-term targets.
That opens the possibility of an upside liquidity sweep.
Should Ethereum break above its 4-hour trendline, it could quickly move into those overhead liquidity pockets, triggering short liquidations and accelerating a squeeze toward the $1.70K-$1.80K region.
At the same time, liquidity also exists below current prices near the support zone, meaning both bulls and bears remain exposed to sharp, liquidation-driven swings.
When combined with the improving RSI divergence and the tightening price structure, the current setup leans toward an initial move higher before the market decides whether a larger recovery is truly underway.
The reaction around the $1.72K-$1.80K liquidity zone may ultimately reveal Ethereum’s next major trend.
Disclaimer: BlockNews provides independent reporting on crypto, blockchain, and digital finance. All content is for informational purposes only and does not constitute financial advice. Readers should do their own research before making investment decisions. Some articles may use AI tools to assist in drafting, but every piece is reviewed and edited by our editorial team of experienced crypto writers and analysts before publication.


 English (US) ·