
 4 hours ago
29
4 hours ago
29
- Ethereum recorded all-time highs in active addresses, transactions, and network throughput during Q1 2026.
- Tokenized assets and institutional adoption continued expanding even as DeFi activity and ETH price weakened.
- Technical indicators remain cautious, but growing network usage suggests long-term fundamentals are strengthening.
Ethereum spent much of the first quarter of 2026 battling falling prices and a difficult macro environment, but beneath the surface, the network was telling a much different story.
According to Token Terminal’s latest quarterly report, Ethereum experienced a split narrative. While several DeFi-related metrics weakened as crypto markets struggled, network activity surged to record levels and tokenized assets continued attracting institutional interest. In other words, price action looked shaky, but the blockchain itself kept getting busier.
DeFi Activity Slows as Market Conditions Weigh on Capital
The decline in crypto prices naturally impacted Ethereum’s DeFi ecosystem.
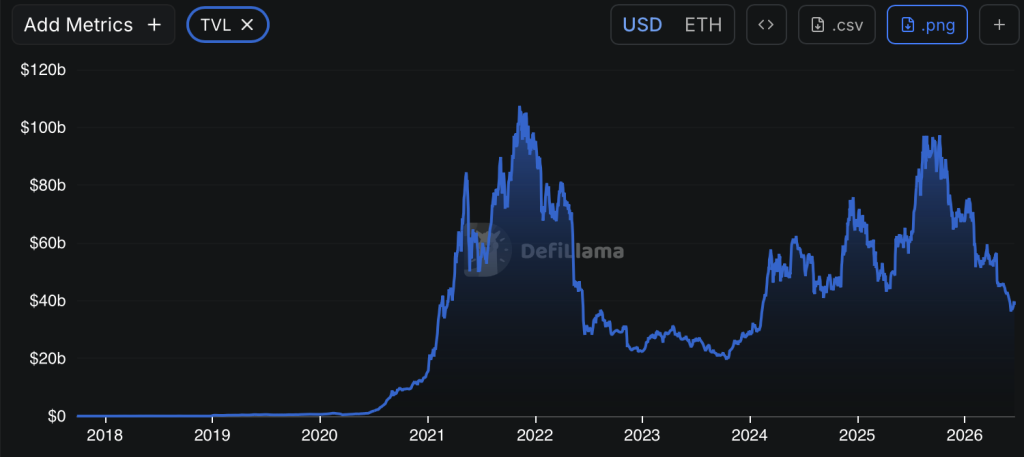
Total Value Locked (TVL), which measures the amount of capital deployed across applications built on Ethereum, fell 11% quarter-over-quarter. Even so, the broader picture remains impressive. TVL is still up 22% compared to the same period last year, highlighting Ethereum’s continued dominance despite market turbulence.
At roughly $316.2 billion in locked value, Ethereum remains far ahead of its closest competitors. In fact, it still maintains a substantial lead over chains such as Tron, Solana, BNB Chain, and Plasma combined.
Lending activity also cooled during the quarter. Active loans across Ethereum averaged $21.8 billion, marking a 16.6% decline from the previous quarter. Aave, the network’s largest lending protocol, contributed significantly to that drop after loan activity fell roughly 24%.
Part of the slowdown coincided with several high-profile departures from the Aave ecosystem, including core contributors and development groups. Despite the setback, Ethereum still accounts for nearly 80% of active loans among the industry’s leading blockchain networks.
Decentralized trading volumes faced similar pressure.
Spot trading volume across Ethereum-based exchanges reached $134.5 billion during Q1, representing a 24% decline quarter-over-quarter and a 31.2% drop year-over-year. Platforms like Uniswap, Curve, and CoW Swap continued driving most of the activity, though overall market participation remained subdued.
Tokenization Continues to Strengthen Ethereum’s Position
While parts of DeFi struggled, tokenization remained one of Ethereum’s brightest spots.
The market value of tokenized assets held relatively steady at $203.4 billion during the quarter. Although that represented a slight 0.7% decline from the previous quarter, the category expanded nearly 43% year-over-year.
Stablecoins continue to dominate the sector, accounting for almost $179 billion in tokenized value on Ethereum. Even with a modest quarterly decline, stablecoins remain one of the blockchain’s most important use cases.
Elsewhere, tokenized investment funds grew to $19.4 billion, while tokenized commodities posted the strongest growth of all. The category expanded 60% quarter-over-quarter to $4.7 billion, largely driven by tokenized gold products.
Ethereum now controls approximately 84% of all tokenized commodities among the top blockchain networks.
Industry observers believe this trend reflects growing institutional confidence.
According to Etherealize, institutions aren’t choosing Ethereum because of ideology or marketing narratives. They’re choosing it because the liquidity, infrastructure, and existing financial ecosystem already exist there. Each new tokenized asset strengthens the network effect, making Ethereum increasingly difficult to ignore.
Network Usage Explodes to New Records
Perhaps the most surprising part of the report came from Ethereum’s network activity.
Monthly active addresses climbed to an average of 13.2 million during Q1, setting a new record. That represents growth of 53.5% from the previous quarter and nearly 86% compared to a year earlier.
Transaction activity followed the same trend.
Ethereum processed roughly 200.4 million transactions during the quarter, an increase of 38% quarter-over-quarter and 81.5% year-over-year. Network throughput also reached new highs, averaging 25.78 transactions per second.
Those are massive numbers, especially during a period when ETH itself was under pressure.
Interestingly, transaction fees moved in the opposite direction.
Fees generated across the network dropped to 39.9 million during Q1, down almost 48% from the previous quarter and more than 81% compared to last year. The decline followed Ethereum’s Fusaka upgrade, which significantly expanded data capacity and lowered average transaction costs.
Supporters argue this reflects a classic example of Jevons Paradox. As transactions become cheaper, usage increases dramatically. Over time, expanding demand could potentially outweigh the impact of lower fees.
Not everyone agrees, however.
Some analysts have pointed out that part of the activity surge may have been driven by address-poisoning attacks and automated transactions that became economically viable after fees fell. As a result, separating genuine adoption from network noise remains an ongoing challenge.
ETH Valuation Weakens Despite Growing Participation
Ethereum’s market valuation struggled throughout the quarter.
The network’s fully diluted market capitalization declined to roughly $290 billion, representing a 30.3% quarterly drop and a 9.9% decrease year-over-year.
Despite that weakness, staking participation continued growing.
The ratio between staked ETH market value and Ethereum’s overall market capitalization climbed to 0.31, up from 0.28 during the previous quarter. That increase suggests long-term holders remain committed to securing the network even as prices fluctuate.
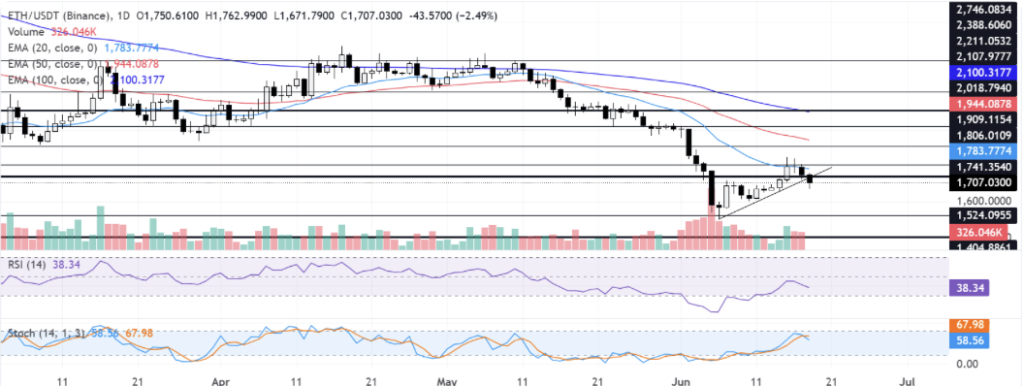
Ethereum Price Faces Critical Resistance Levels
From a technical perspective, Ethereum remains under pressure.
ETH continues trading below its 20-day, 50-day, and 100-day exponential moving averages, all clustered between roughly $1,784 and $2,100. The recent breakdown beneath a previously rising trendline has further reinforced bearish sentiment in the short term.
Momentum indicators tell a slightly more balanced story.
The Relative Strength Index currently sits near 38, indicating downside momentum has weakened somewhat but has not completely disappeared. Selling pressure appears to be stabilizing rather than accelerating.
On the upside, Ethereum faces initial resistance around $1,741, followed by the 20-day EMA near $1,784 and another barrier around $1,806. Beyond those levels, sellers could emerge near $1,909, the 50-day EMA around $1,944, and the broader resistance zone stretching from $2,018 to $2,108.
Meanwhile, support remains near $1,524. If that level fails, deeper downside targets could emerge around $1,405 and potentially $1,156.
For now, Ethereum presents a fascinating contrast. Price remains cautious, DeFi activity has cooled, yet network participation and tokenization continue hitting milestones. Whether that divergence eventually resolves higher for ETH remains one of the biggest questions facing crypto markets today.
Disclaimer: BlockNews provides independent reporting on crypto, blockchain, and digital finance. All content is for informational purposes only and does not constitute financial advice. Readers should do their own research before making investment decisions. Some articles may use AI tools to assist in drafting, but every piece is reviewed and edited by our editorial team of experienced crypto writers and analysts before publication.


 English (US) ·