
 5 hours ago
18
5 hours ago
18

At $1,660, Ethereum sits in a confirmed bearish regime, trading well below every meaningful moving average. The Ethereum price today reflects a market gripped by extreme fear. However, the daily setup looks stretched to the downside in a way that historically precedes a volatile resolution.
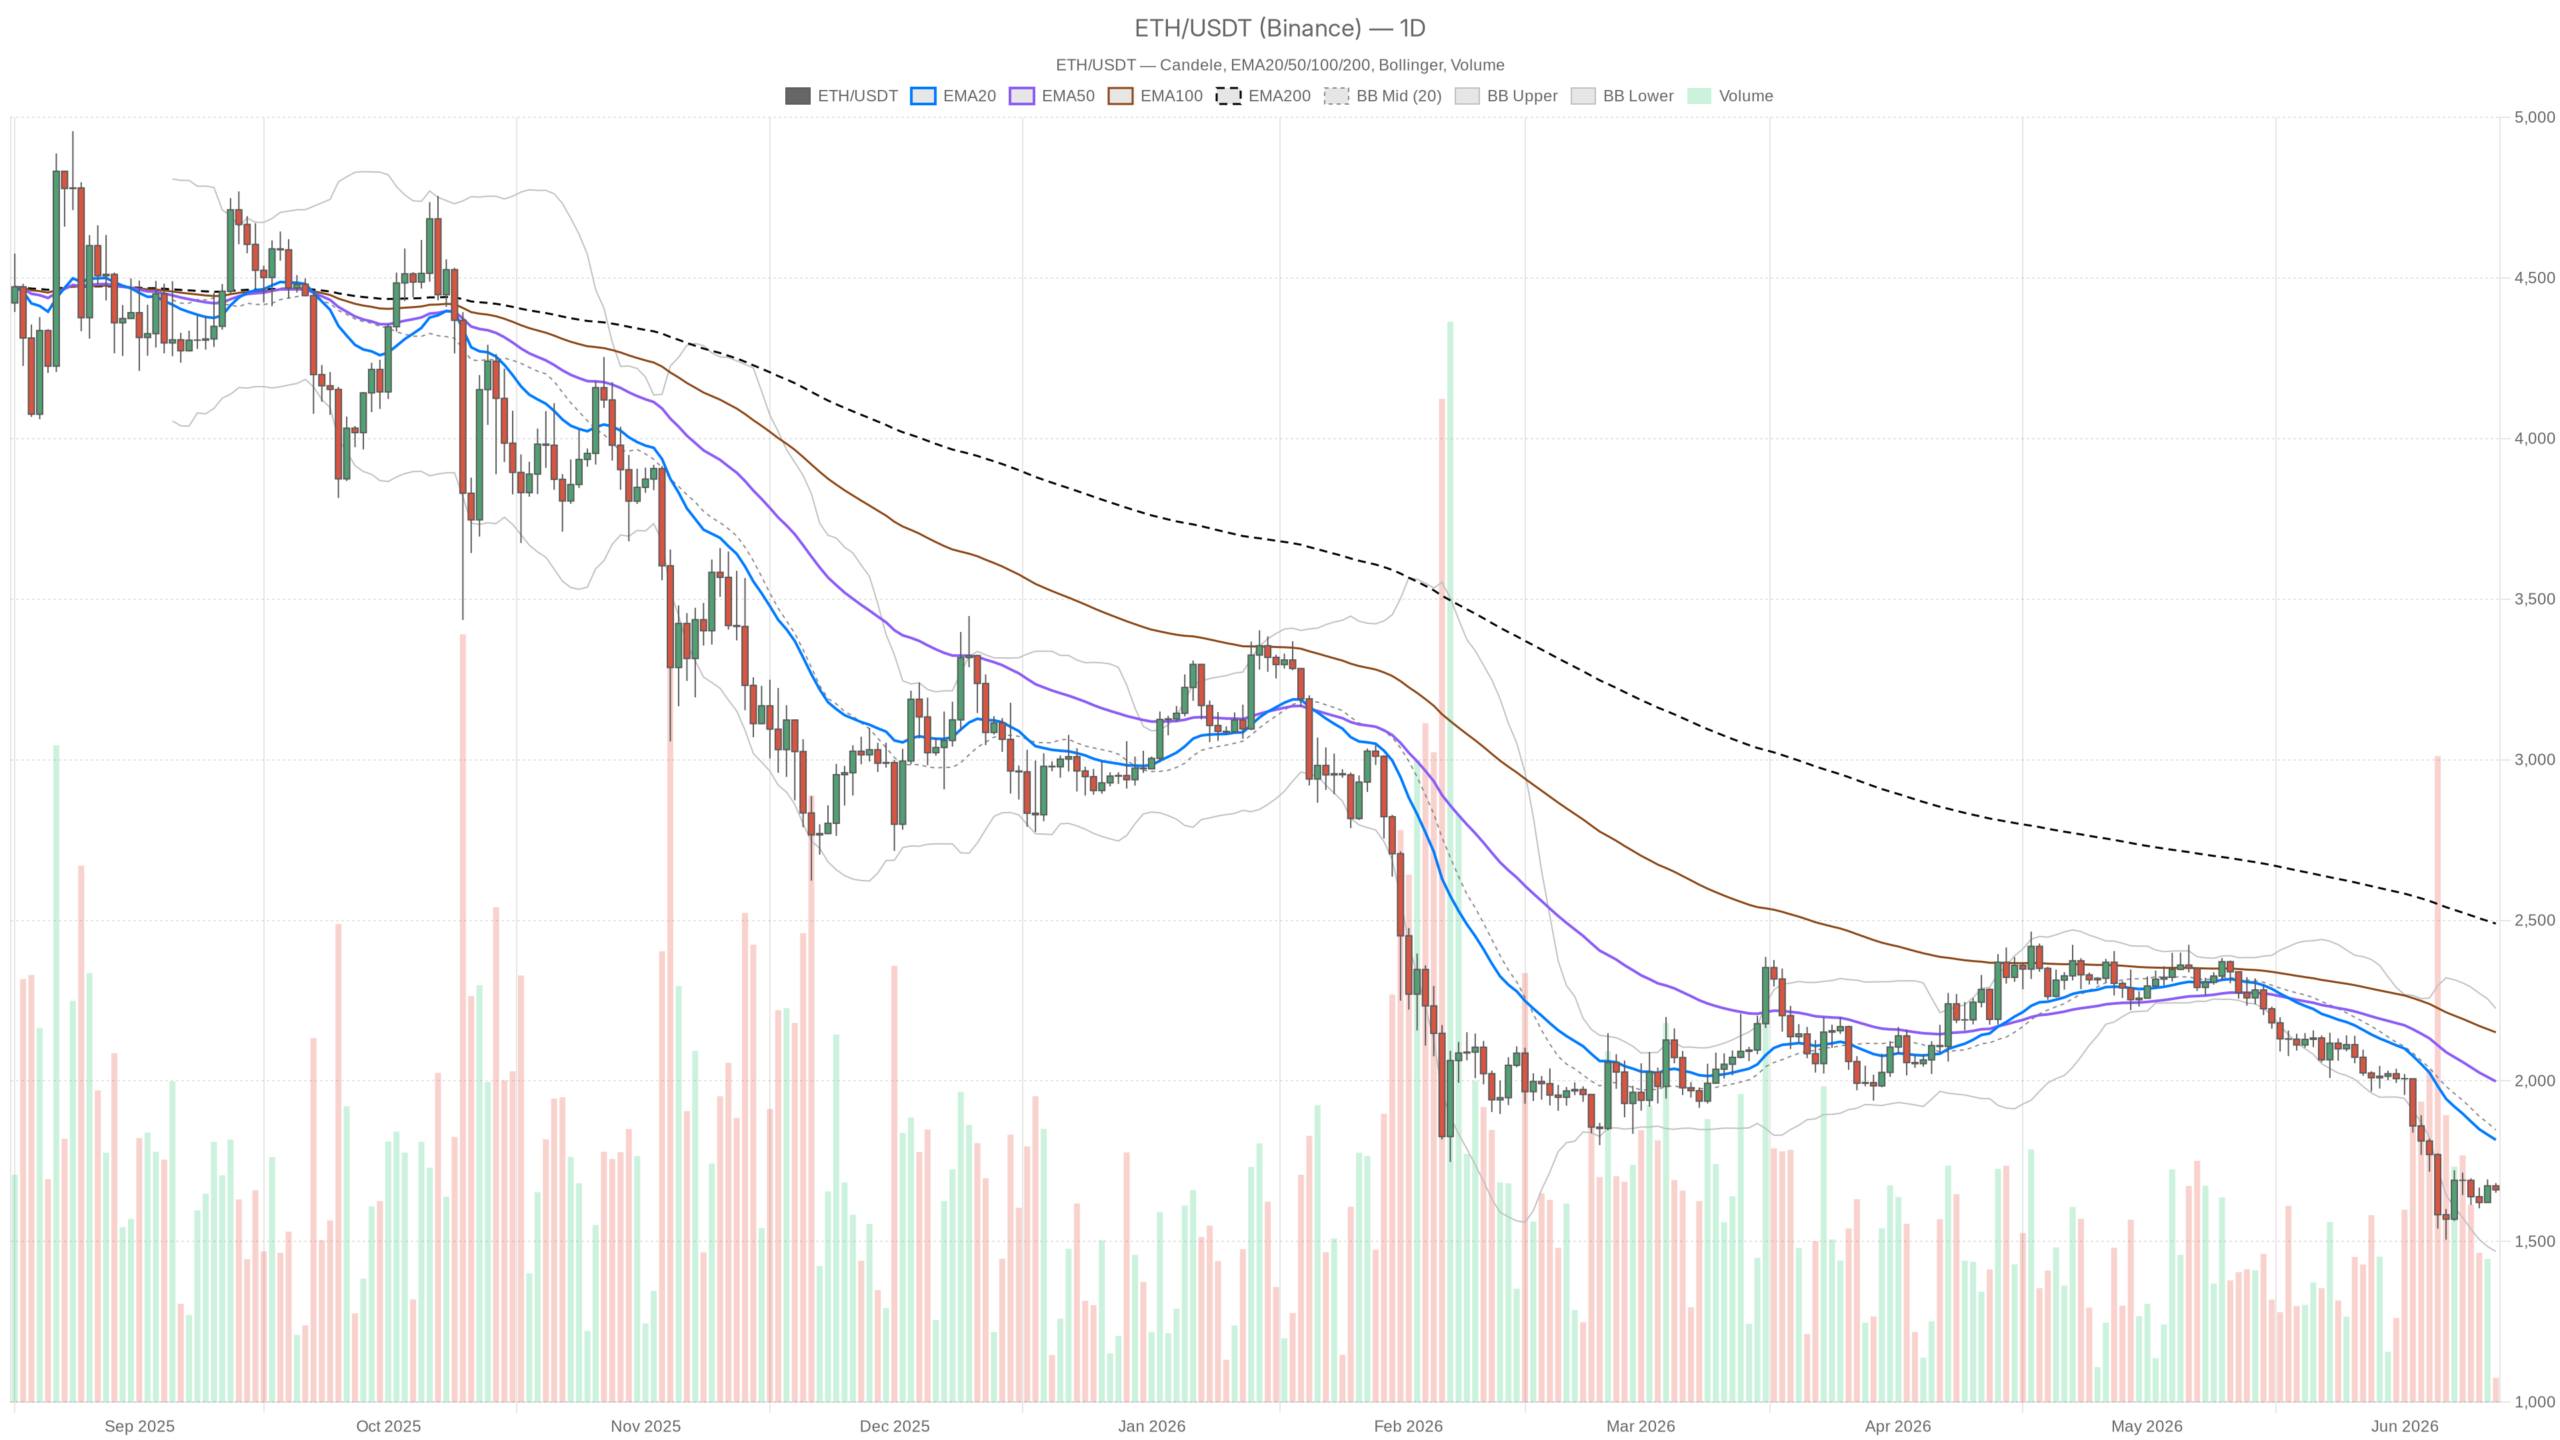 ETH/USDT — daily chart with candlesticks, EMA20/EMA50 and volume.
The Daily Chart: Bearish Structure, But Reaching an Extreme
On the daily timeframe, Ethereum is printing below its EMA20 ($1,816), EMA50 ($1,998), and EMA200 ($2,489). All three are in a clean downward stack. Price is significantly below these levels, reflecting a trend that has been losing momentum for months. The gap between current price and the EMA200 is nearly $830, underscoring how far ETH has drifted from what long-term participants would consider fair value territory.
Oversold Signals and Momentum
The daily RSI at 30.51 sits right on the edge of the classic oversold threshold. It has not crossed below 30 yet, but it is knocking at the door. The last time ETH spent extended time at these RSI levels, it navigated a prolonged bottoming process — not a clean V-shaped reversal. Oversold does not mean a bounce is imminent. It means the selling has been aggressive enough to exhaust short-term momentum, yet structure can remain broken for weeks.
Meanwhile, the daily MACD remains in negative territory, with the line at -138.96 against a signal of -130.42 and a histogram of -8.53. The histogram is slightly worsening, meaning the bearish impulse has not yet fully decelerated. There is no bullish crossover in sight on this timeframe. The signal confirms the trend, not a reversal.
Bollinger Bands on the daily place the midline at $1,847 and the lower band at $1,469. Current price at $1,660 sits in the lower half of the range, closer to the floor than the mean. A reversion to the midband would imply a move back toward $1,847 — roughly 11% upside from here. The upper band at $2,225 marks the outer boundary of any aggressive recovery scenario. Price has not yet tagged the lower band at $1,469, which means there is still room to compress further if selling resumes.
Furthermore, the daily ATR of $95.79 indicates this asset is moving in roughly $100 swings per day. That is substantial volatility relative to current price, meaning both opportunity and pain are amplified. Any stop placement needs to account for that kind of daily range. Daily pivot levels frame the immediate context tightly: PP at $1,664, R1 at $1,677, and S1 at $1,647. ETH is pinned around the pivot, indicating the market is in a decision zone rather than trending with conviction.
Shorter Timeframes: Consolidation and Execution Context
Hourly Picture
On the 1H chart, the picture shifts to neutral. The EMA20 ($1,665) and EMA50 ($1,658) are nearly flat, with price sandwiched between them — classic consolidation behavior. The EMA200 on the hourly at $1,695 is acting as overhead resistance. ETH has not reclaimed it, which is a quiet warning that any hourly recovery attempt remains unconvincing.
The hourly RSI at 48.7 is essentially neutral, showing no momentum in either direction. The MACD line (3.80) is barely positive, but the signal line (6.19) is higher, generating a negative histogram of -2.39. That reflects a mild bearish divergence in short-term momentum. Hourly Bollinger Bands ($1,639–$1,694) are relatively tight, which typically precedes a directional expansion. Whether that break goes up or down is the live question.
15-Minute Execution Context
The 15-minute frame does not change the macro narrative, but it matters for entries. Price is below the EMA20 ($1,665) and EMA50 ($1,667), with the MACD in negative territory and RSI at 42.31 — a mild bearish lean. The EMA200 on the 15m at $1,658 sits below price, providing a sliver of short-term support. The 15m Bollinger midline sits at $1,667 and price hovers just below it. For intraday traders, the $1,662–$1,667 zone is where the micro battle plays out.
Market Context: Fear Is the Dominant Tone
The Fear & Greed Index at 12 — deep in Extreme Fear territory — is doing double duty here. On one hand, it validates the bearish pressure and confirms that sentiment does not support a sustained rally. On the other hand, historically, readings this low have marked the tail end of distribution phases. The problem is timing: extreme fear can persist for weeks before resolving. Catching the exact bottom in this environment is a high-risk endeavor even for experienced traders.
Moreover, the broader market cap at $2.24 trillion with near-zero 24h change and declining volume (-5.3%) reinforces the picture of a fatigued market. Ethereum’s ecosystem data — with DEX volumes and fees collapsing across Uniswap and Curve — adds a fundamental layer to the technical weakness. When both on-chain activity and price trend lower simultaneously, it takes more than a chart bounce to change the story.
Bullish Scenario: What Would Need to Happen
For bulls to make a credible case, the first requirement is a daily close above the EMA20 at $1,816. That level has acted as resistance for weeks, and reclaiming it with volume would signal the bearish structure is cracking. A sustained move through $1,816 would trigger short-covering toward the daily Bollinger midline at $1,847. Beyond that, the $1,998–$2,000 zone around the EMA50 becomes the next real test. This scenario is invalidated if ETH fails to hold above $1,650 on a daily closing basis and slides toward the lower Bollinger band at $1,469.
Bearish Scenario: The Path of Least Resistance
Conversely, the bearish case requires less imagination — it is simply the continuation of what is already happening. A break and daily close below $1,647 would confirm pivot support is gone. That opens the door toward the $1,469 lower Bollinger band. In a full capitulation scenario, a flush through $1,469 toward the $1,400–$1,350 range is not out of the question. This scenario is invalidated by a rapid reclaim of the $1,700–$1,720 area on an hourly basis, ideally with a pickup in DEX volume and a Fear & Greed recovery above 20.
Positioning and Risk Awareness
In this environment, the setup rewards patience more than aggression. The daily trend is clearly bearish and the hourly is neutral at best. Anyone considering a long position here is betting on a mean-reversion trade against a confirmed downtrend. That is a legitimate strategy, but it demands disciplined sizing and wide stops given the $95 daily ATR. With the Fear & Greed at 12, the market is priced for continued pain. Any positive surprise — macro data, a protocol upgrade, a shift in BTC dominance — could trigger a sharp move higher simply because positioning is skewed to the downside.
The honest read is that Ethereum is in no man’s land: technically oversold on the daily but structurally broken across all timeframes. The Ethereum price today sits in a zone where every bounce should be treated as a relief rally within a downtrend rather than a trend change. Until price can sustain itself back above $1,816 on a daily close, the bearish structure remains intact. The risk is real, the volatility is elevated, and the next significant move is likely to be fast.


 English (US) ·