
 2 months ago
34
2 months ago
34

IBM stock closed at $211.20 on July 15 after a profit warning triggered massive selling. Nearly 27.8 million shares changed hands. Price sits deep in oversold territory across all timeframes. The bearish bias is unambiguous. Momentum and sentiment have both realigned to the downside.
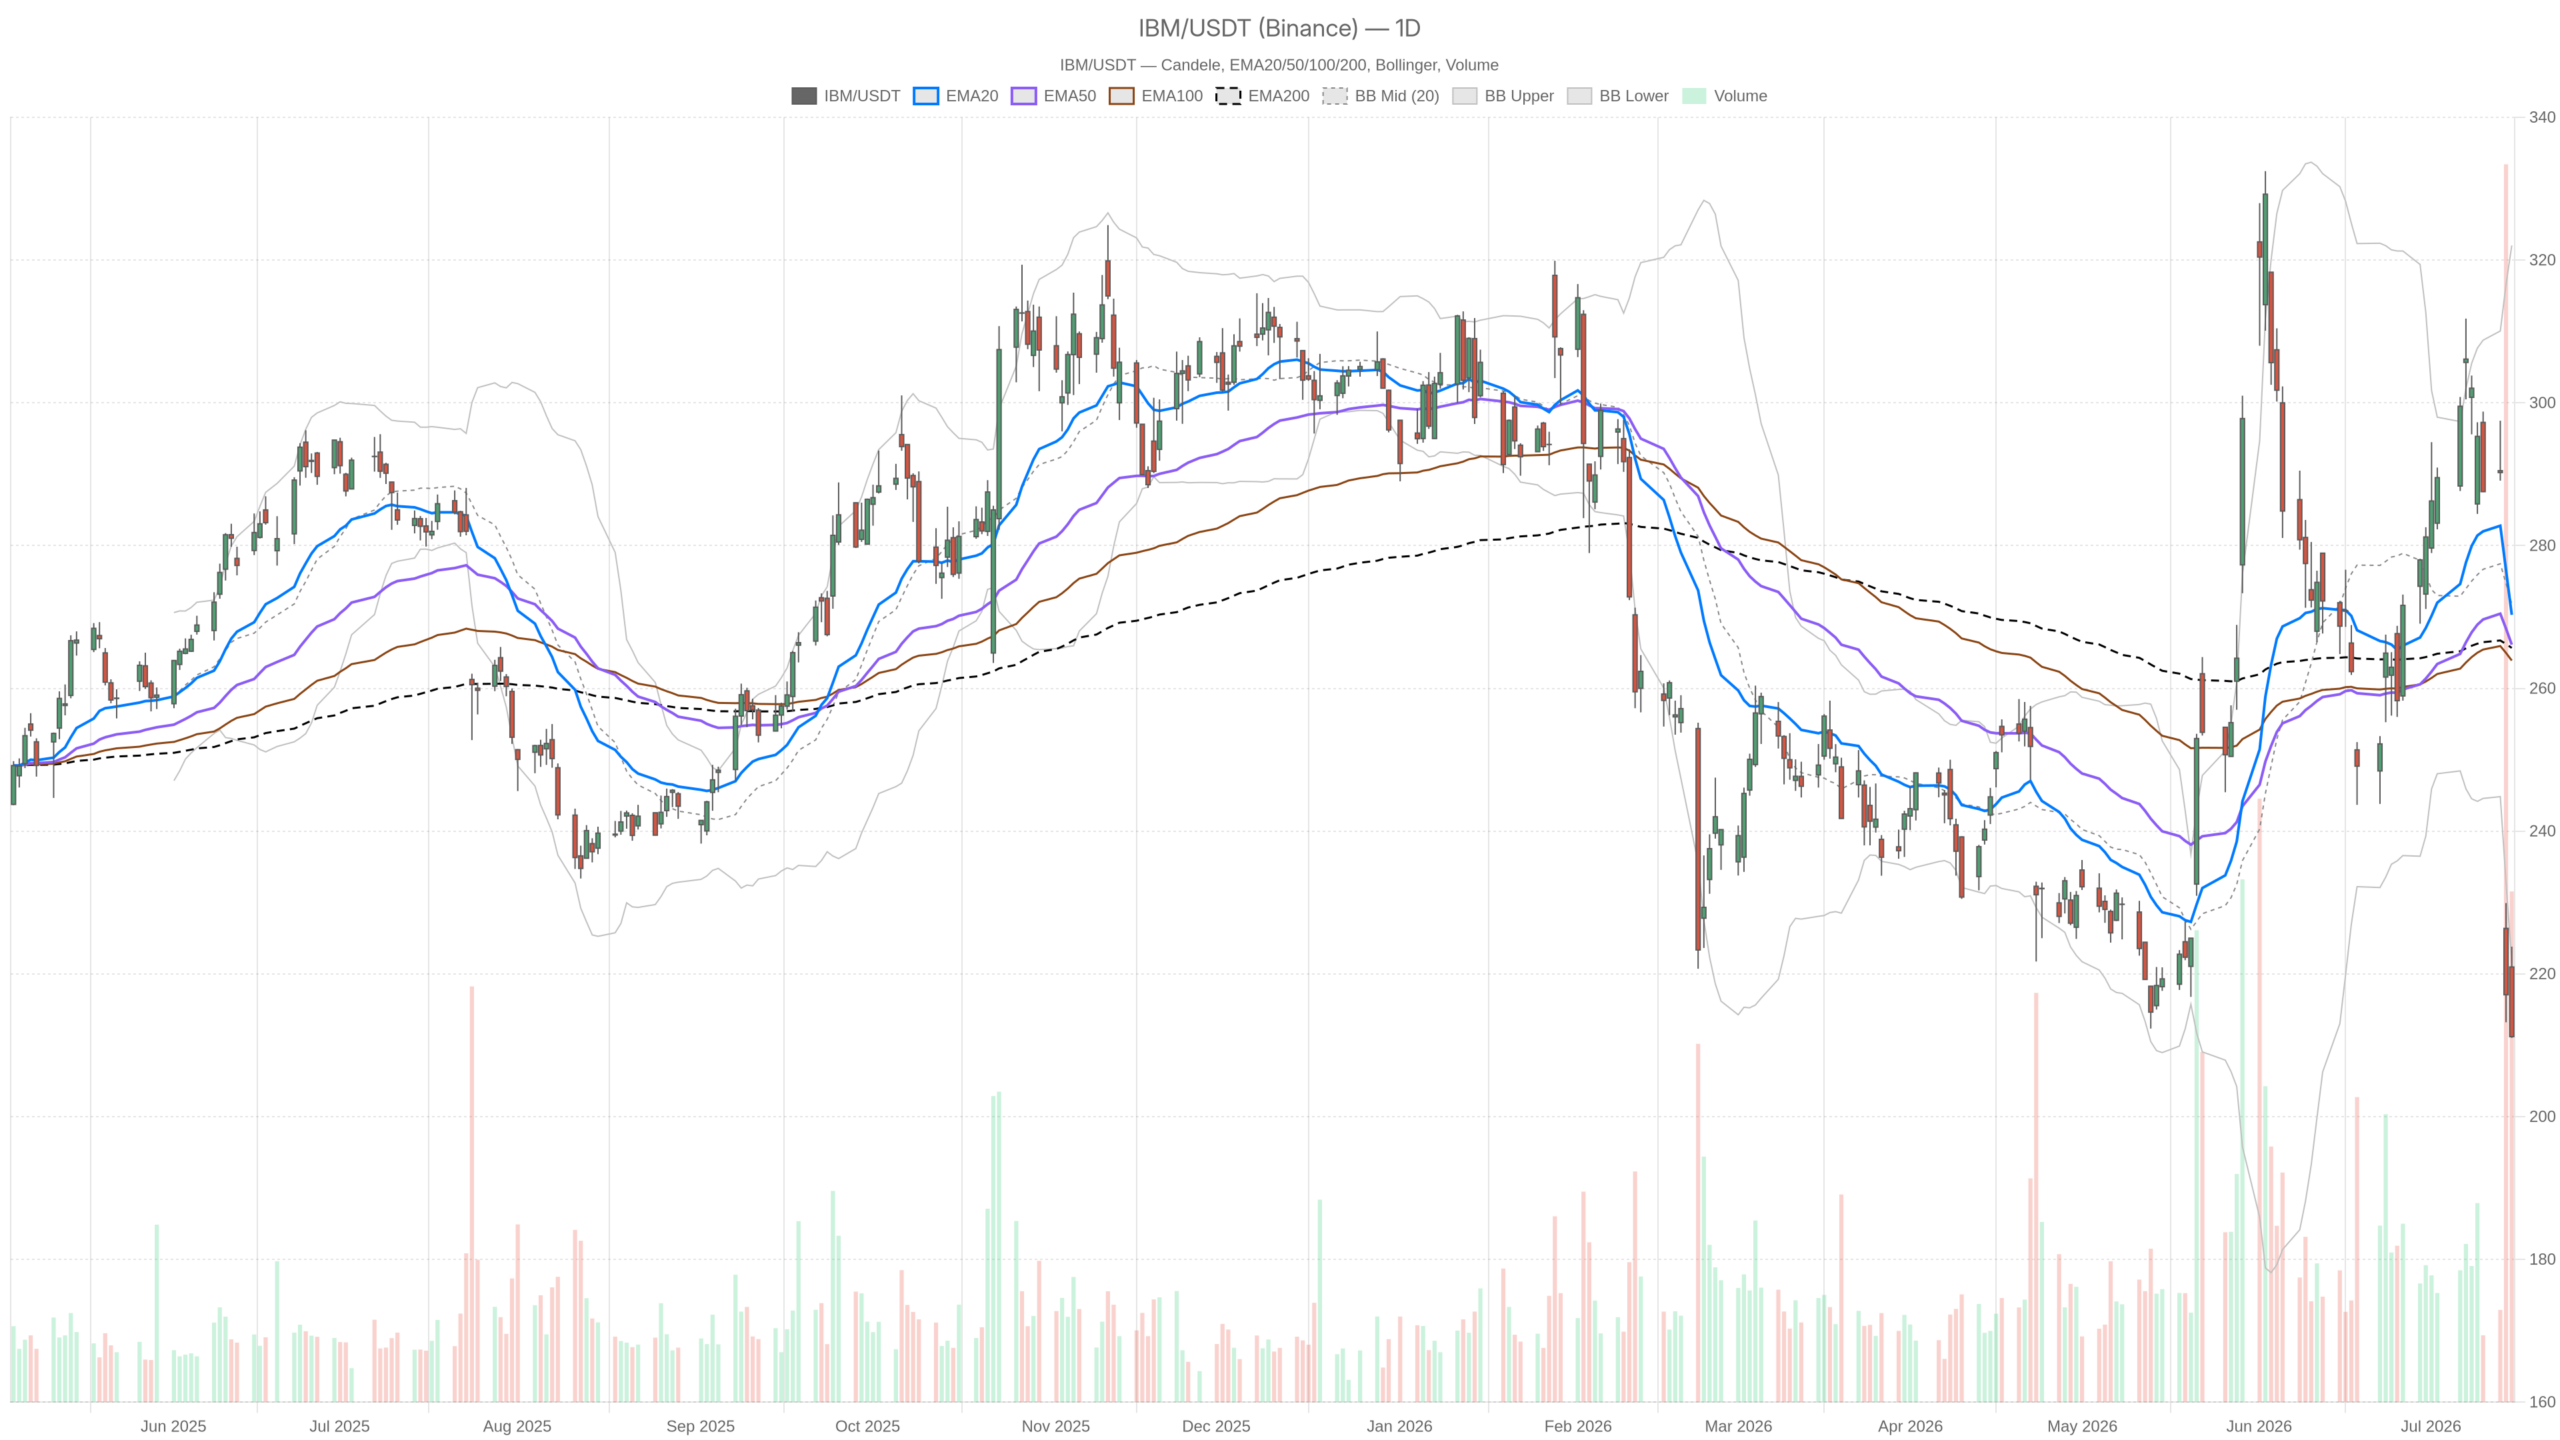 IBM — daily chart with candlesticks, EMA20/EMA50 and volume.
Key takeaways
- IBM stock closed at $211.20 on July 15 after a profit warning triggered heavy institutional selling
- The daily RSI at 29.17 sits just above the oversold threshold, while the MACD histogram plunged to -7.75
- Volume surged to nearly 27.8 million shares, confirming a distribution phase is underway
- The hourly RSI printed 14.97 — one of the most extreme oversold readings on the standard RSI scale
- Price trades roughly $55 below the nearest daily EMA, with all three moving averages now acting as distant resistance
Daily Chart: IBM Stock Technical Damage Runs Deep
IBM stock trades roughly $55 below its nearest dynamic resistance on the daily chart, with every momentum indicator confirming deeply bearish conditions. No reversal signal is present.
On the daily timeframe, IBM stock sits well below all three key exponential moving averages. The EMA20 rests at $270.30, the EMA50 at $266.12, and the EMA200 at $265.67. That gap alone signals how violently the stock has been repriced in a matter of sessions.
The daily RSI at 29.17 places IBM just outside classic oversold territory. However, oversold readings following fundamental shocks rarely trigger immediate reversals. They tend to reflect rational selling rather than emotional capitulation.
Momentum Indicators Confirm Bearish Control
The MACD structure on the daily chart points to sustained, broad-based selling with no sign of momentum exhaustion.
The MACD line stands at -3.34 against a signal line of 4.41, producing a histogram reading of -7.75. That spread is not the mark of a normal corrective phase. Instead, it signals institutional repositioning playing out over days rather than hours.
Meanwhile, price has broken decisively below the lower Bollinger Band at $221.58. A close below this band on heavy volume typically signals either capitulation or the beginning of a new, lower trading range. The midband at $271.82 now functions as a distant ceiling rather than a mean-reversion target.
Volatility Context and Pivot Framework
Elevated volatility and broken pivot support leave IBM stock with limited technical floors in the near term.
The daily ATR of $16.92 reflects how dramatically intraday swings have expanded. Position sizing must account for outsized daily moves in either direction. The daily pivot point sits at $215.35, with R1 at $219.66 and S1 at $206.89. Price closed below the pivot, confirming bearish intraday structure. The next meaningful floor lies at S1 — $206.89.
Hourly Chart Confirms the IBM Stock Breakdown
The hourly timeframe reinforces the bearish picture without softening it, showing a deeply inverted moving average stack and extreme momentum readings.
On the hourly chart, the EMA structure is sharply inverted. The EMA20 sits at $234.17, the EMA50 at $259.29, and the EMA200 at $269.06. IBM stock at $211.20 trades below all three, with the gap to the EMA200 exceeding $57. In trending markets, this kind of separation represents a multi-week recovery target rather than a near-term magnet.
Extreme Oversold Readings Without Reversal Signals
The hourly RSI at 14.97 is among the most extreme oversold readings possible, yet it likely reflects forced selling rather than a genuine exhaustion signal.
In trending markets following earnings shocks, deeply compressed RSI readings often persist for multiple sessions. The hourly MACD line at -19.86 versus a signal of -19.40 yields a histogram of -0.47. That near-zero histogram is worth watching — it could indicate that bearish momentum is beginning to flatten. Still, a cross into positive territory would be needed to argue even tactical stabilization.
Hourly pivot levels are tightly clustered. The pivot sits at $211.91, with R1 at $212.79 and S1 at $210.32. Price is pinned near the pivot, with minimal room between resistance above and support below. This compression at extreme oversold levels suggests a pause, not a recovery.
The Earnings Miss Driving IBM Stock Lower
A profit warning from management — not sector-wide weakness — triggered the sell-off, resetting IBM stock’s technical map in a single session.
IBM’s management revised growth expectations for the current quarter, triggering what multiple sources described as an epic 25% crash. The profit warning has placed the stock firmly in the penalty box — a market condition where valuation re-rating takes time. Price typically struggles to recover until new guidance restores confidence.
Notably, IBM’s dismal preliminary results highlight a widening divergence within the tech sector. Software and chip stocks are no longer moving in lockstep. This is being read as a company-specific signal rather than a sector-wide warning. That distinction reduces the likelihood of sector rotation providing a near-term tailwind.
On the other hand, some observers frame the sell-off as a potential generational buying opportunity. They point to IBM’s growing quantum computing infrastructure and its public roadmap toward fault-tolerant processors. The company runs a fleet of superconducting quantum processors and offers cloud access via IBM Quantum. These are legitimate long-term assets. However, long-term thesis and short-term price action operate on very different timescales — and the technical map currently favors patience over positioning.
What a Bullish Reversal Would Require
A credible bullish case for IBM stock requires more than an oversold RSI — it demands price stabilization above key pivot levels and a shift in momentum structure.
First, IBM stock must stabilize above the daily S1 support at $206.89. A close back above the daily pivot point of $215.35 would begin to suggest sellers are exhausting. Ideally, price would also reclaim R1 at $219.66. On the hourly chart, a positive MACD histogram crossover, combined with the RSI recovering toward 30–40, would add technical confirmation to any recovery attempt.
From a sentiment standpoint, a credible re-rating also requires revised guidance from management. The market needs to believe the profit warning was a one-time reset rather than the start of structural deterioration. Until that clarity arrives, rallies into resistance should be treated with caution.
Bearish Scenario: Why IBM Stock’s Path Points Lower
The bearish case requires little imagination — IBM stock sits in a distribution phase with the next technical target at $206.89 and the $200 psychological area below that.
If IBM stock fails to reclaim the daily pivot at $215.35 and closes multiple sessions below $211, the S1 at $206.89 becomes the immediate target. A break below that level would open a move toward the $200 round number — a gravitational floor in high-volatility sell-offs.
Furthermore, the daily MACD histogram at -7.75 shows no sign of narrowing toward zero. Combined with price sitting below the lower Bollinger Band, this supports the view that IBM stock remains in a distribution phase. The penalty-box dynamic adds a sentiment overlay: institutional buyers are likely to wait for at least one clean earnings quarter before re-engaging at scale.
Positioning IBM Stock in a High-Volatility Environment
IBM stock presents a high-risk, low-visibility environment where the burden of proof rests firmly on the bulls.
The daily bias is bearish, the hourly confirms it, and the 15-minute chart offers only a minor stabilization footnote. Volatility — with a daily ATR of $16.92 — remains dangerously elevated. Any position taken in either direction must be sized accordingly. The quantum computing narrative provides a long-term anchor, but long-term anchors do not prevent short-term drawdowns from deepening.
For now, IBM stock remains a technically broken chart trading at extreme oversold levels following a fundamental shock. Until price reclaims the pivot and momentum indicators begin to turn, the path of least resistance points lower.
FAQ
How far could IBM stock fall after the earnings crash?
The next technical support sits at the daily S1 level of $206.89. A break below that would open the $200 psychological area. The daily MACD histogram at -7.75 shows no sign of narrowing, suggesting selling pressure remains intact and a new, lower trading range may be forming.
Is IBM stock oversold enough for a bounce?
The daily RSI at 29.17 and hourly RSI at 14.97 are deeply oversold. However, oversold readings following fundamental shocks rarely trigger immediate reversals. They tend to reflect rational repositioning rather than emotional capitulation. A credible bounce requires price to reclaim the daily pivot at $215.35.
What triggered the IBM stock sell-off?
IBM’s management issued a profit warning and revised growth expectations downward for the current quarter. The sell-off — described by market sources as a 25% crash — reflects a fundamental reset of earnings expectations rather than a routine technical correction. Nearly 27.8 million shares traded on the session.
Does IBM’s quantum computing business change the near-term outlook?
IBM has legitimate long-term assets in quantum computing, including superconducting processors and cloud access via IBM Quantum. However, the long-term investment thesis and short-term price action operate on very different timescales. The technical damage from the earnings shock is immediate; the quantum payoff is measured in years, not weeks.
Disclaimer: This article is for informational purposes only and does not constitute financial advice, an investment recommendation, or a solicitation to buy or sell any financial instrument or cryptocurrency. The analysis provided is not indicative of future results. Investing in crypto assets and financial markets carries a high risk of capital loss. Always do your own research (DYOR) and consult a qualified financial advisor before making any decision.
Article produced with the assistance of artificial intelligence and reviewed by the editorial team.






 English (US) ·