
 4 hours ago
18
4 hours ago
18
Nano Nuclear Energy Inc. stock closed at $15.91, down sharply from an open near $17.13 and well below levels seen just weeks earlier. The daily chart confirms a bearish regime, with price beneath every major moving average. However, the hourly picture shows a pause rather than acceleration lower.
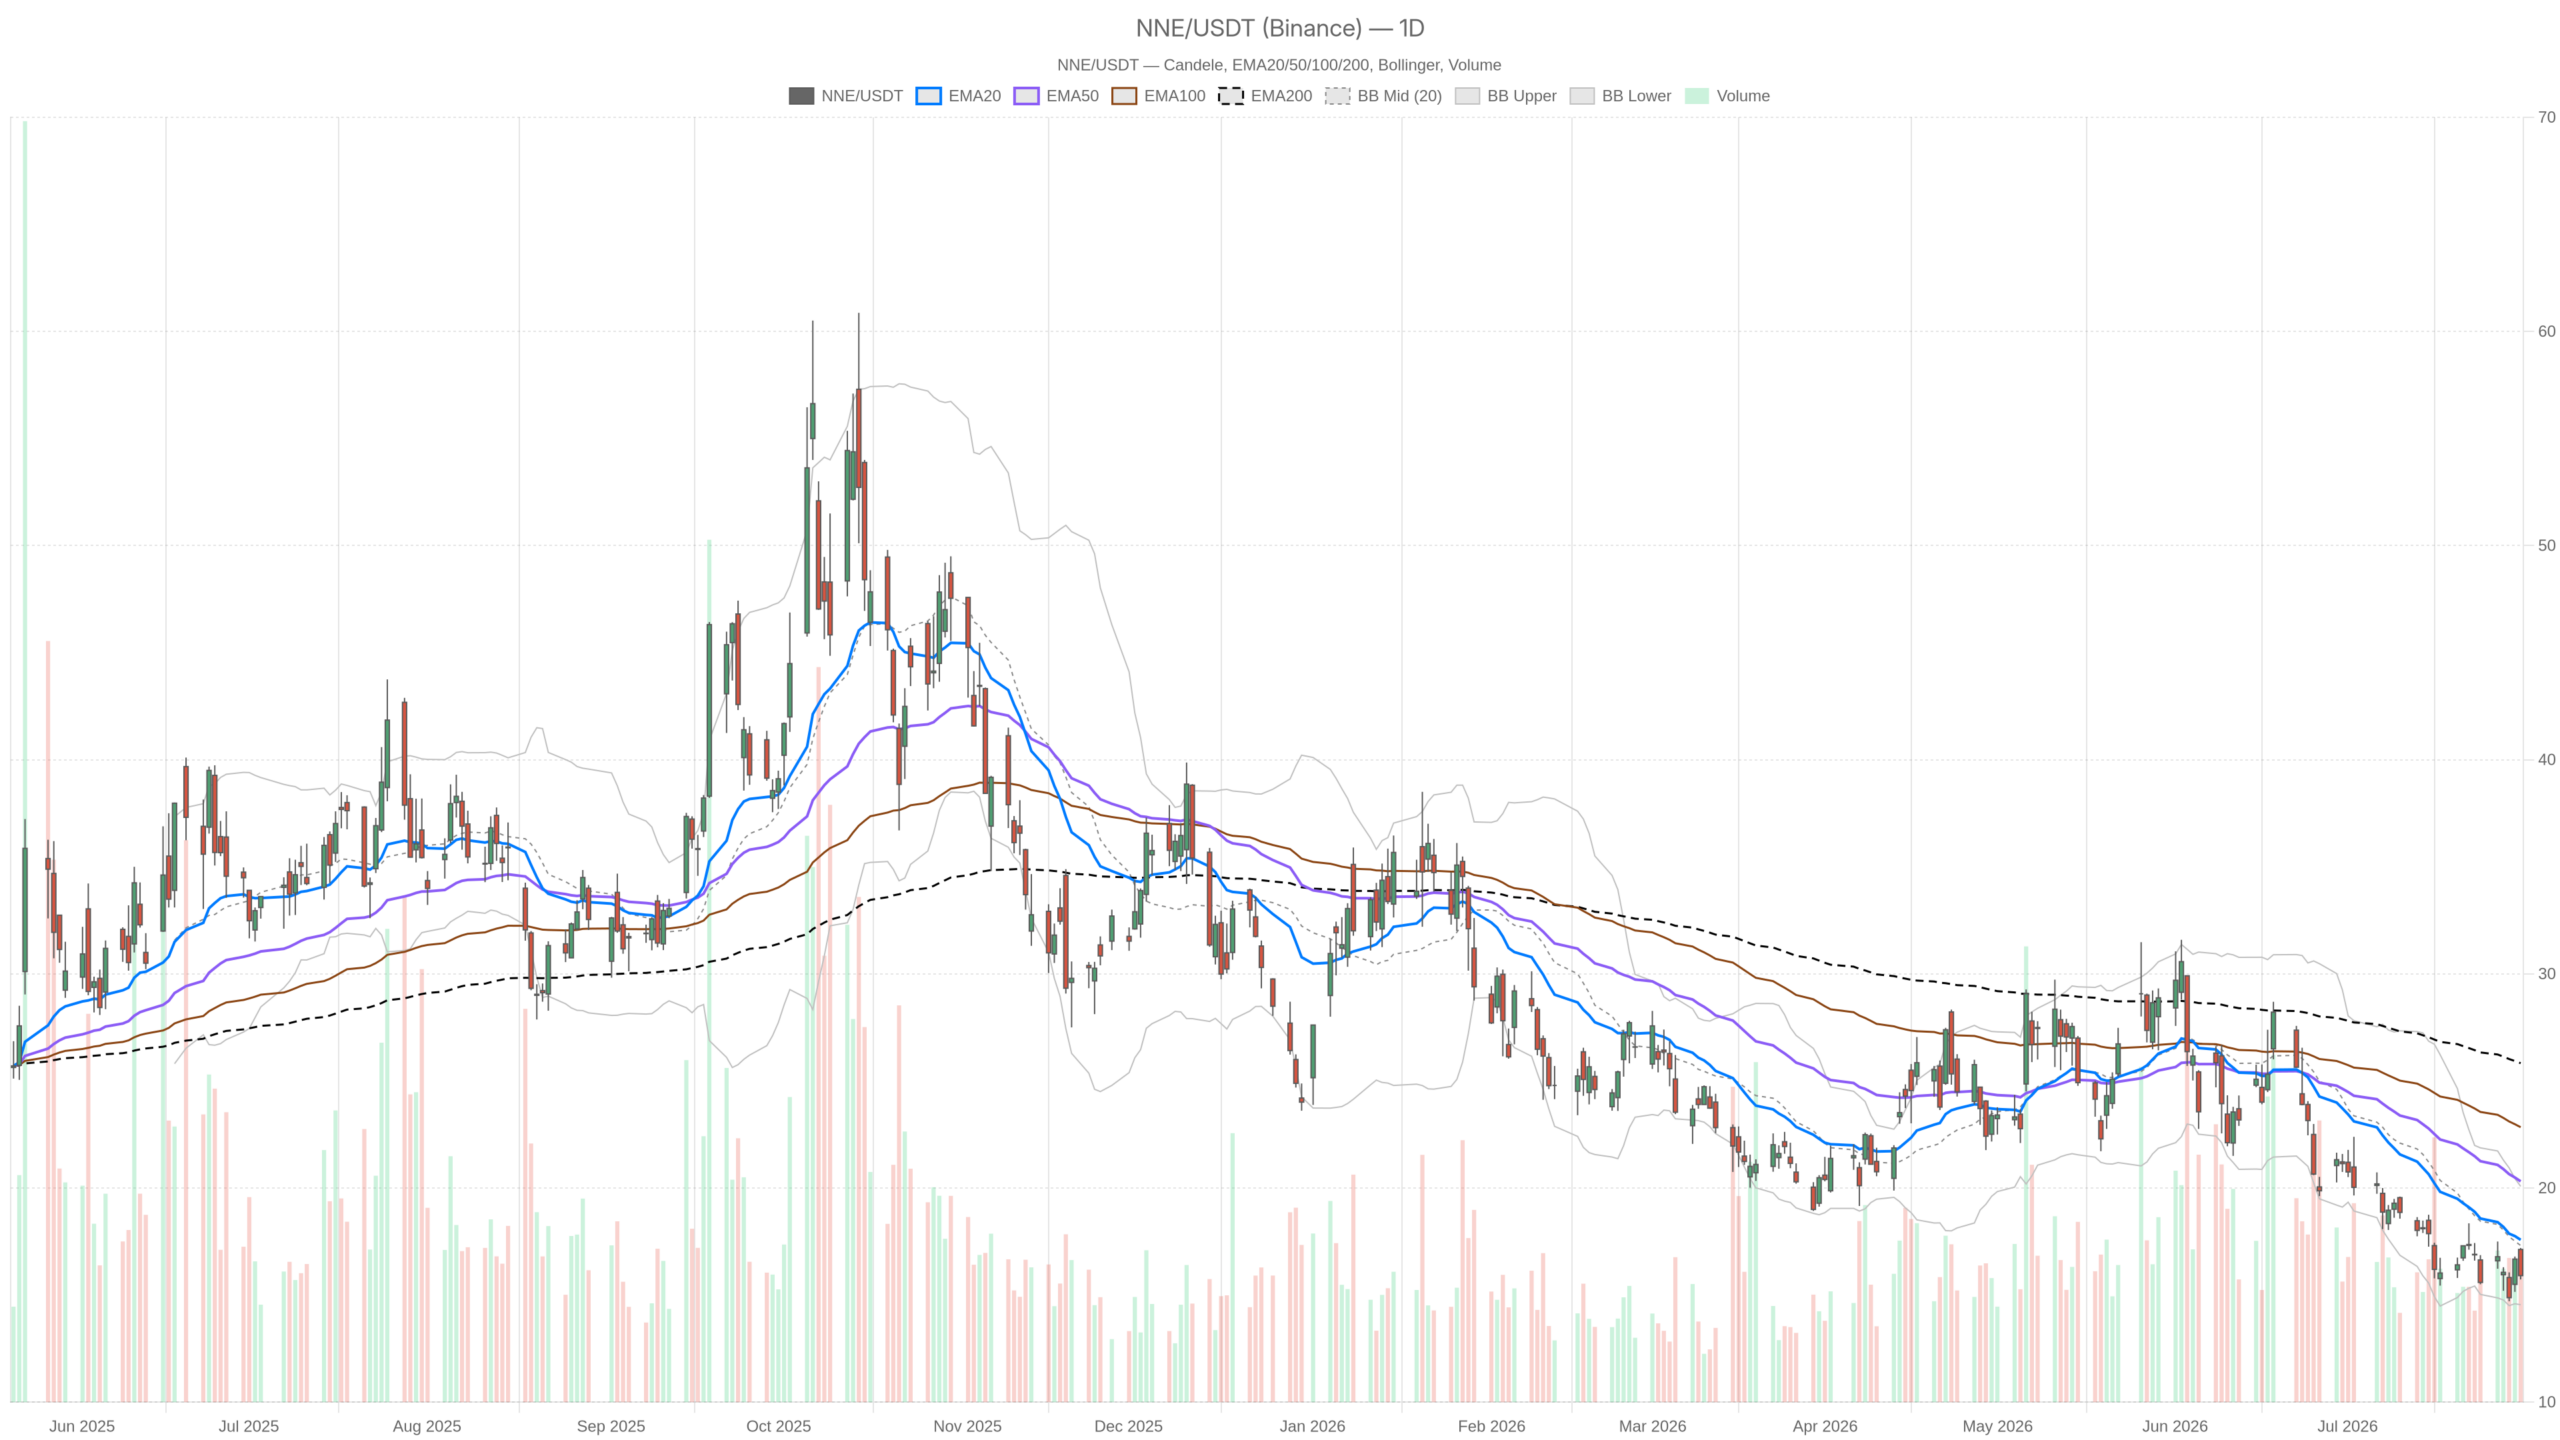 NNE — daily chart with candlesticks, EMA20/EMA50 and volume.
Key takeaways
- NNE closed at $15.91, trading below all major daily moving averages including the EMA200 at $25.83
- Daily RSI14 at 39.8 leaves room for further downside before oversold conditions emerge
- Hourly MACD has flattened near zero, signaling momentum stalling rather than accelerating lower
- A break below S1 at $15.36 opens the path toward the lower Bollinger Band at $14.55
- NANO Nuclear Energy recently secured an AFWERX Phase I award, advancing the KRONOS MMR for the U.S. Air Force
Daily Structure Confirms a Stock Under Distribution
Nano Nuclear Energy Inc. stock is under clear distribution on the daily timeframe. Price sits below the EMA20 at 17.58, the EMA50 at 20.31, and the EMA200 at 25.83. That stacked bearish alignment confirms the platform’s daily regime reading unequivocally.
During the session, NNE printed a high of 17.20 and a low of 15.73 before settling at 15.91. The wide range reflects genuine selling pressure. Notably, the distance between spot price and the EMA200 underscores how far this stock has fallen from its longer-term average.
RSI14 on the daily sits at 39.8, below the neutral 50 line but not yet in oversold territory. That leaves room for further downside without triggering classic exhaustion signals. Meanwhile, MACD shows both the line at -1.62 and the signal at -1.75 deeply negative. Yet the histogram has turned slightly positive at 0.13. That suggests downside momentum is decelerating rather than accelerating. It is not a reversal signal on its own, but it is worth watching.
The Bollinger setup adds context. With the mid-band at 17.31 and the upper band at 20.08, price trades closer to the lower boundary at $14.55. That positioning typically reflects a stock stretched to the downside. Sharp mean-reversion bounces become more likely, even within a broader downtrend. Daily ATR14 stands at 1.36, meaning single-session swings of over a dollar are the norm. On pivots, the daily point sits at 16.28, with resistance at 16.83 (R1) and support at 15.36 (S1). Price closing below the pivot and near S1 keeps the near-term bias tilted lower.
Hourly Timeframe Shows Momentum Stalling, Not Reversing
For NNE, the hourly chart confirms the bearish daily structure. Price at 15.88 remains below the EMA20 at 16.03, EMA50 at 16.22, and EMA200 at 18.80. Yet momentum tells a different story. RSI14 on the hourly sits at 47.42, essentially neutral. MACD has flattened almost completely, with the line at 0.00 and the signal at -0.01. That is not the profile of a market in freefall. It looks more like consolidation after the initial drop.
This is the key conflict in the current Nano Nuclear Energy Inc. stock setup. The daily trend is unambiguously bearish, but hourly momentum has cooled rather than confirmed further downside. In contrast to the daily histogram’s modest positive tick, the hourly MACD is essentially flat. This suggests indecision rather than conviction in either direction over the next several sessions.
Hourly Bollinger Bands reinforce the sense of a pause. The mid-band sits at 15.86, the upper at 17.05, and the lower at 14.67. Price hovers around the middle of the range. Meanwhile, the hourly pivot at 15.94 is extremely tight, with resistance at 16.01 and support at 15.80. That compression signals the market is coiling before its next directional move.
15-Minute Chart: Execution Context Only
The 15-minute chart offers execution context only, with the regime reading neutral across the board. EMA20 at 16.06, EMA50 at 16.05, and EMA200 at 16.13 are tightly clustered. That is a classic sign of short-term indecision. RSI14 at 41.45 and a slightly negative MACD histogram of -0.01 suggest mild, low-conviction selling pressure at the micro level.
Notably, ATR14 here is just 0.13. Short-term volatility has compressed meaningfully relative to the daily and hourly ranges. For traders using this timeframe purely for execution timing, the tight pivot band between support at 15.82 and resistance at 15.98 is the level to watch for the next intraday move.
Bullish Scenario: A Path Toward Recovery
A bullish reversal for Nano Nuclear Energy Inc. stock requires reclaiming the daily pivot at $16.28. That must be followed by a push through the hourly EMA50 near 16.22. The fundamental backdrop offers some support for such a move. NANO Nuclear Energy shares rose 4% after the company was selected for a Small Business Innovation Research Phase I award through AFWERX. The contract is tied to advancing the KRONOS MMR for the U.S. Air Force. It strengthens the company’s relationship with the Department of the Air Force and expands its defense deployment pathway.
Broader sector coverage has also framed NNE alongside peers like OKLO and SMR as part of the next phase of nuclear growth. This narrative is tied to AI-driven electricity demand, smaller reactor designs, and faster licensing. Should sentiment around that theme strengthen, a recovery toward the daily EMA20 at $17.58 becomes a realistic target.
Bearish Scenario: Downtrend Extension Remains the Base Case
The bearish case remains the dominant technical narrative until proven otherwise. A break below the daily S1 at $15.36 would open the door toward the lower Bollinger Band at $14.55, extending the current downtrend meaningfully. The daily EMA200 sits all the way up at 25.83. The structural gap between price and the long-term average illustrates how deep this decline already is.
Therefore, any failure to hold above the hourly support cluster near 15.80–15.86 would likely reinforce seller control. That would invalidate the early signs of momentum stabilization seen on the 1H MACD. It would also confirm the bearish regime’s continued dominance over Nano Nuclear Energy Inc. stock.
Nano Nuclear Energy Inc. Stock at a Crossroads
Overall, Nano Nuclear Energy Inc. stock sits at a genuine inflection point between timeframes. The daily trend is bearish and well-established. The hourly momentum has cooled into something closer to consolidation. Volatility remains elevated on the daily chart. An ATR of 1.36 points to continued wide swings, even as the 15-minute range compresses ahead of the next directional decision.
In short, positioning around this name requires patience given the mixed signals between trend and momentum. Close attention is needed to whether news flow can offset the technical damage already on the chart. Defense contracts and the broader nuclear-AI demand narrative remain the key upside catalysts to watch.
FAQ
What is the current trend for Nano Nuclear Energy Inc. stock?
The daily trend is firmly bearish, with price at $15.91 trading below all major moving averages. The EMA20 sits at 17.58, the EMA50 at 20.31, and the EMA200 at 25.83, creating a stacked bearish alignment confirmed by the platform’s regime reading.
Is Nano Nuclear Energy Inc. stock showing signs of a reversal?
Not yet. While hourly momentum has stalled—with MACD flattening near zero and RSI at a neutral 47.42—this suggests consolidation rather than reversal. A bullish reversal would require reclaiming the daily pivot at $16.28 and pushing through the hourly EMA50 near 16.22.
What are the key support levels for NNE stock?
The immediate support sits at the daily S1 pivot of $15.36. Below that, the lower daily Bollinger Band at $14.55 becomes the next significant level. On the hourly chart, the support cluster between 15.80 and 15.86 is critical for maintaining the current consolidation.
What fundamental catalysts could move Nano Nuclear Energy Inc. stock?
NANO Nuclear Energy recently secured an AFWERX Phase I award tied to advancing the KRONOS MMR for the U.S. Air Force, which pushed shares up 4%. Broader sector interest in nuclear energy for AI-driven electricity demand also provides a potential catalyst for NNE and peers like OKLO and SMR.
Disclaimer: This article is for informational purposes only and does not constitute financial advice, an investment recommendation, or a solicitation to buy or sell any financial instrument or cryptocurrency. The analysis provided is not indicative of future results. Investing in crypto assets and financial markets carries a high risk of capital loss. Always do your own research (DYOR) and consult a qualified financial advisor before making any decision.
Article produced with the assistance of artificial intelligence and reviewed by the editorial team.






 English (US) ·