
 2 hours ago
10
2 hours ago
10

Netflix stock is in a clear downtrend, with the technical picture leaving little room for ambiguity. Trading at $81.41 at the close of June 9, NFLX sits well below every major moving average. The bias is unambiguously bearish.
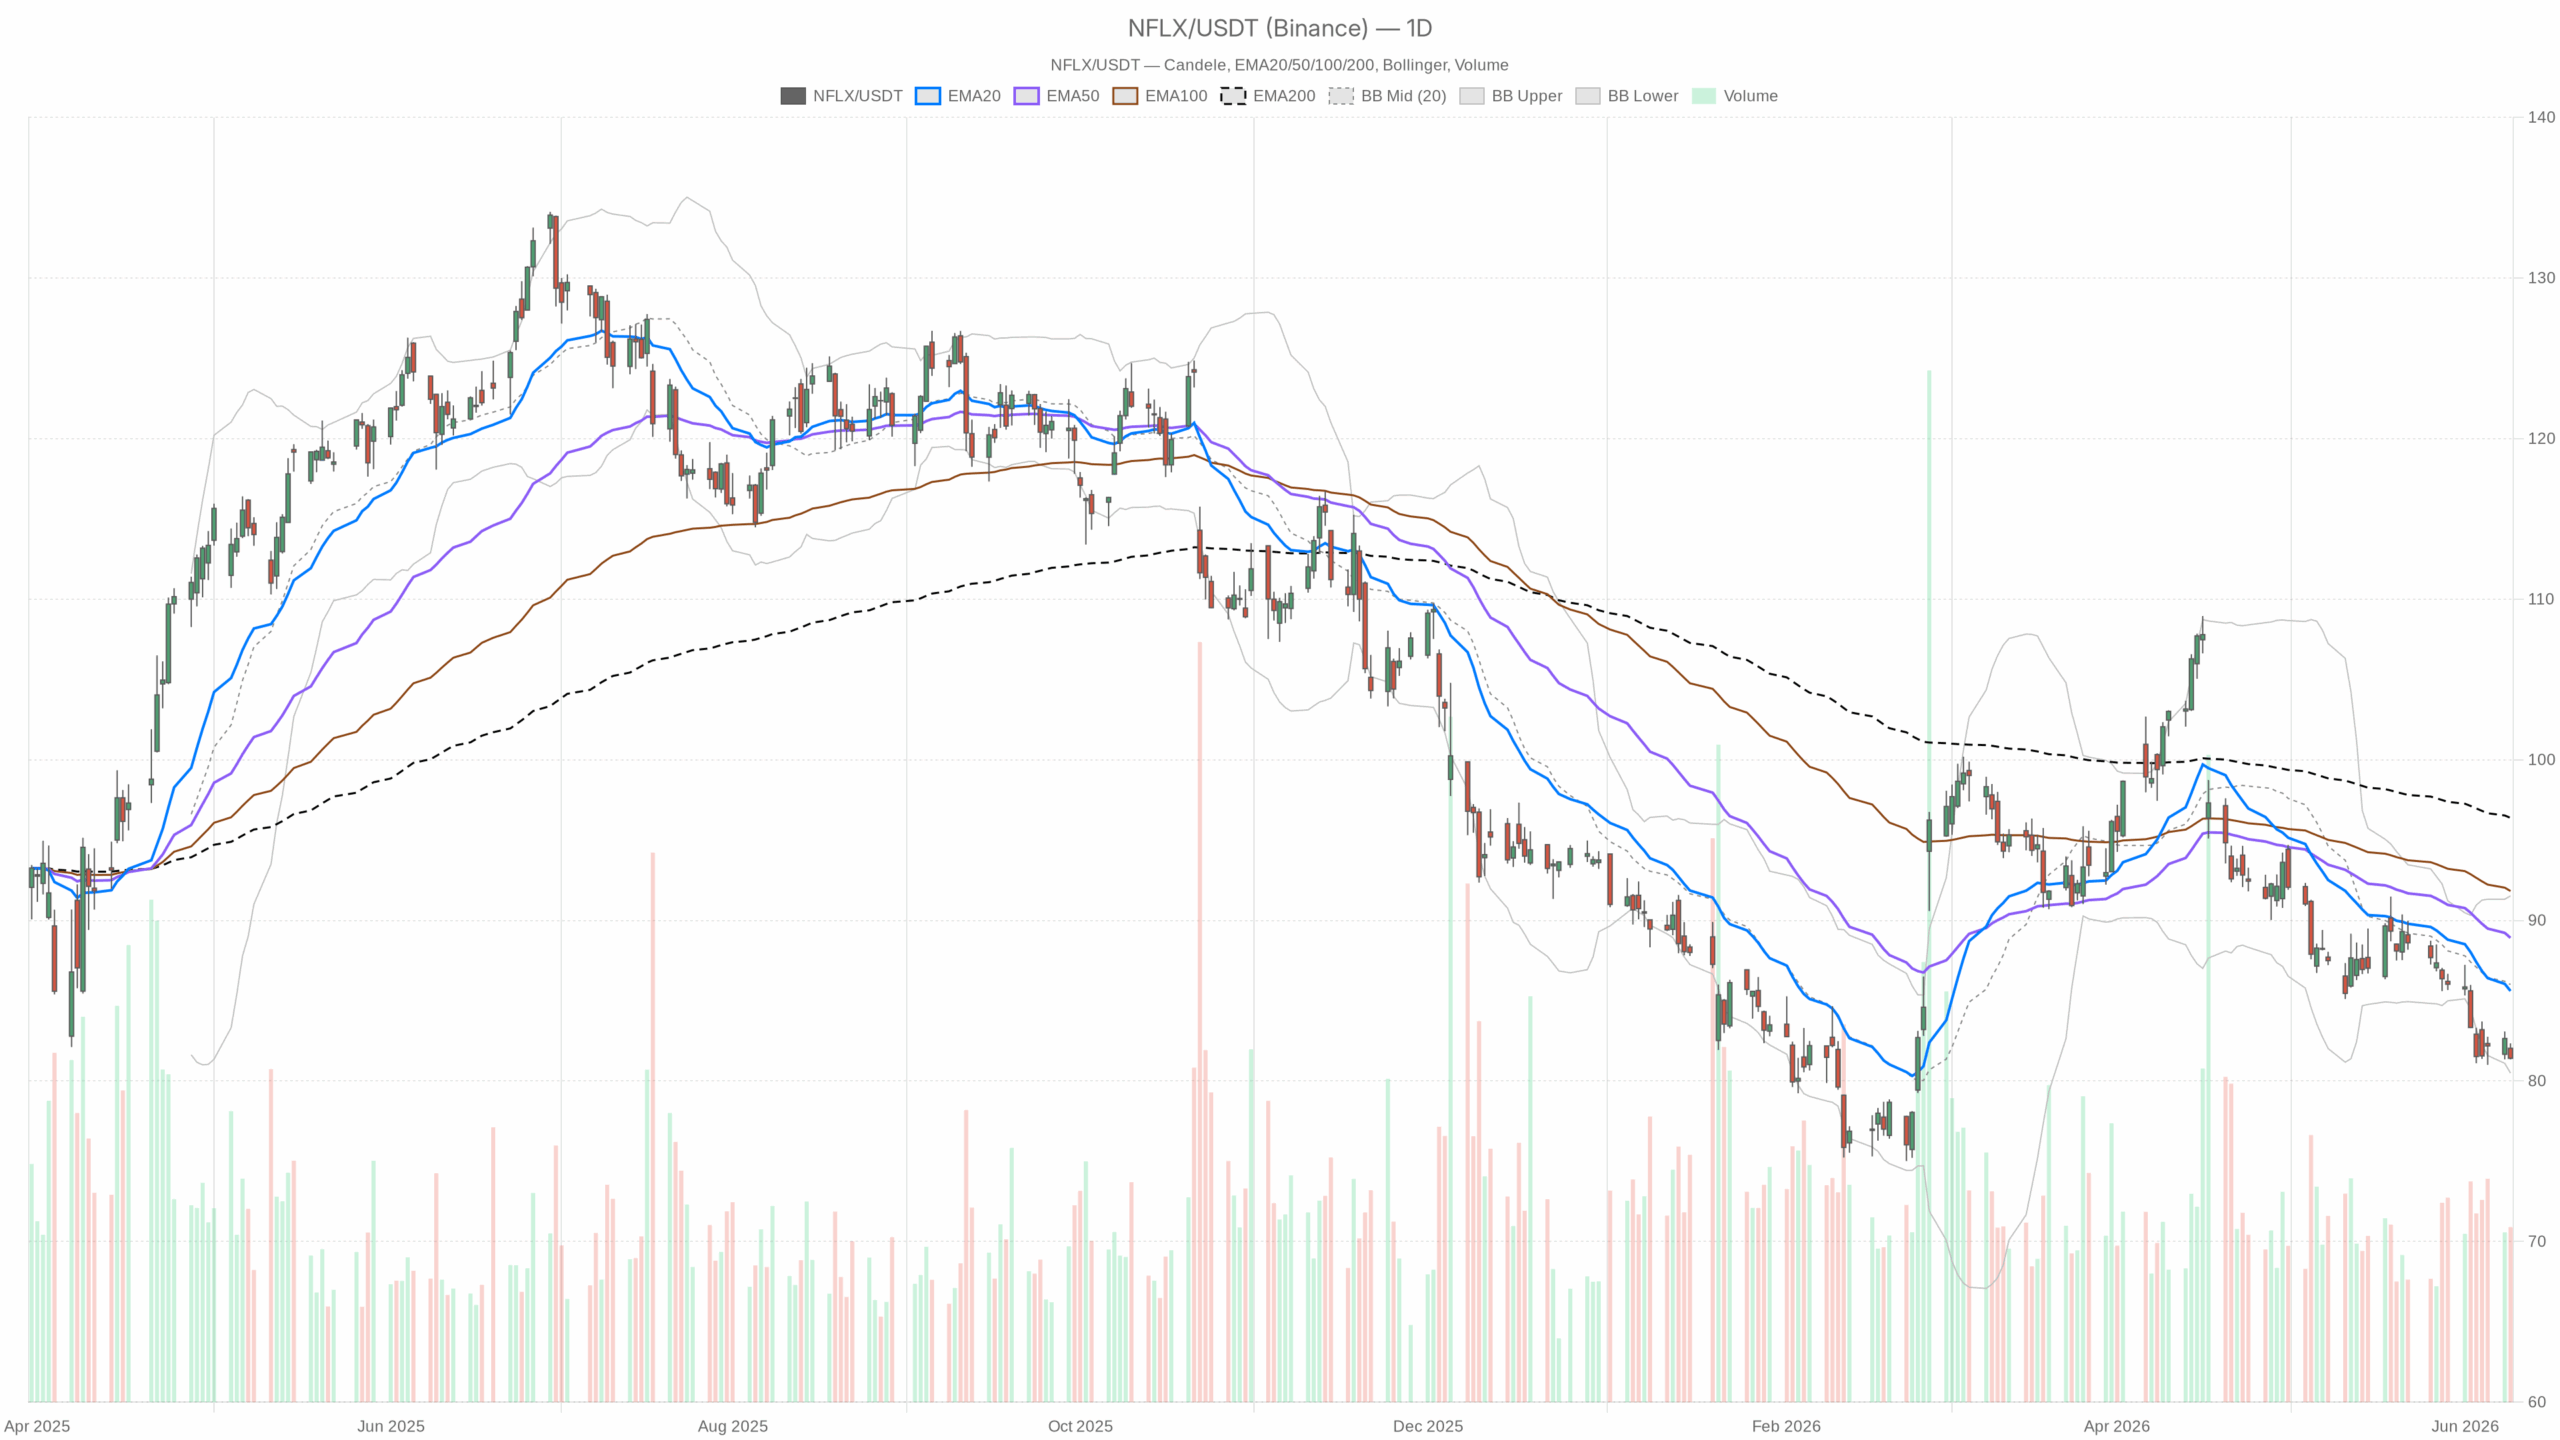 NFLX — daily chart with candlesticks, EMA20/EMA50 and volume.
Netflix Stock Daily Chart: Full Bearish Stack in Control
On the daily timeframe, the structure is deeply damaged. Price trades beneath the EMA20 at $85.60, the EMA50 at $88.91, and the EMA200 at $96.38. This forms a full bearish stack with no nearby dynamic support from above. Each of these levels now acts as resistance. The daily regime is formally classified as bearish, and price action confirms it bar by bar.
RSI and MACD Confirm Persistent Selling Pressure
Notably, the daily RSI at 29.98 tells an important story. It hovers just above the oversold threshold of 30, signaling extreme selling pressure. However, oversold readings alone are not reversal signals. In sustained downtrends, RSI can linger near or below 30 for extended periods without producing any meaningful bounce. That context matters here.
Meanwhile, the daily MACD reinforces the bearish case. The MACD line sits at -2.52, below the signal line at -2.21, with a negative histogram of -0.31. Momentum remains tilted to the downside with no sign of convergence. There is no divergence forming and no hook higher in the histogram that would hint at selling exhaustion.
Bollinger Bands and Pivot Levels Add Pressure
At the same time, Bollinger Bands on the daily frame add further texture. The lower band sits at $80.49, with the midline at $86.00. Price is hugging the lower band, indicating sustained directional pressure rather than consolidation. A close below $80.49 would be technically significant. It would suggest a breakdown beyond one standard deviation and potential acceleration to the downside. The ATR of 1.88 reflects moderate daily volatility — enough for sharp intraday swings without changing the structural trend.
Daily pivot analysis places the pivot point at $81.70, with resistance at $82.05 and support at $81.05. Price closed at $81.41 — beneath the pivot — confirming sellers remained dominant into the close. The tight range between R1 and S1 reflects a stock that is drifting rather than breaking, caught in a slow gravitational pull lower.
Hourly and Intraday Timeframes Confirm the Downtrend
On the 1H chart, the bearish thesis is fully confirmed. Price at $81.42 trades below the hourly EMA20 at $81.99, EMA50 at $82.96, and EMA200 at $87.35. The hourly regime is also classified as bearish. There is no timeframe conflict — both daily and hourly frameworks are aligned. That alignment strengthens conviction behind the bearish scenario.
The hourly RSI at 39.65 is weak but not yet oversold. This suggests sellers remain in control intraday without the market being stretched enough for a mechanical relief bounce. The hourly MACD line and signal line are both at -0.28, with a near-flat histogram. The lines are virtually convergent, pointing to a momentary pause in selling rather than any genuine recovery. It is a drift, not a reversal.
Additionally, hourly Bollinger Bands narrow the picture. The lower band sits at $81.09, the upper at $82.84, with the mid at $81.96. Price presses the lower half of the band range, consistent with the broader directional bias. The hourly ATR of 0.65 indicates tight intraday movement. This creates a coiled environment where a catalyst could produce a sharper directional move.
15-Minute Chart Offers No Reversal Signal
Zooming into the 15-minute timeframe, the picture mirrors the higher timeframes. Price closed at $81.42, with all short-term EMAs — at $81.74, $81.92, and $83.13 — sitting above in a bearish cascade. The 15m RSI at 39.17 and MACD near flat signal no imminent reversal catalyst at the micro level.
Similarly, the 15m ATR of 0.30 reflects compressed short-term volatility. For traders watching intraday levels, the 15m pivot sits at $81.48 with nearby resistance at $81.61. This is a tight ceiling that price is currently failing to reclaim.
Analyst Sentiment vs. Netflix Stock Technical Reality
From a fundamental and sentiment perspective, the picture is more nuanced. Bernstein reiterated an Outperform rating with a $110 price target as recently as June 4. Meanwhile, some analysts openly debate whether Netflix could reach a trillion-dollar market cap by 2030. The market also appears to have approved NFLX’s withdrawal from a notable acquisition — a potential positive for capital discipline. These narratives suggest institutional conviction in the long-term story remains intact even as near-term price action deteriorates.
In contrast, the technicals show a stock that has corrected sharply and is testing its lower Bollinger Band support near $80.49. The gap between analyst targets and current price is wide. However, diverging fundamentals and technicals is not unusual during periods of market stress or rotation.
Netflix Stock: Bullish and Bearish Scenarios
Looking ahead, the bullish scenario would require a reclaim of the daily pivot at $81.70 on a closing basis. This would need to be followed by a move back above the $82.05 resistance level. Beyond that, NFLX would need to recover the EMA20 at $85.60 to signal any meaningful trend repair. A daily RSI crossing back above 35–40 with MACD histogram narrowing toward zero would further validate a potential floor. Any positive earnings revision or subscriber catalyst could serve as the fundamental trigger.
Bearish Case: The Path of Least Resistance
On the other hand, the bearish scenario remains the path of least resistance. A daily close below $81.05 — the daily S1 — would signal fresh selling interest. It would open the door toward the lower Bollinger Band at $80.49. A breach of that level would carry significant technical weight, potentially accelerating the move toward the $79–$80 range. The flat MACD and absence of RSI divergence leave no reliable early warning system if sellers push harder.
Netflix Stock: Key Levels and Strategic Outlook
Overall, NFLX presents a challenging setup for directional traders. The trend is bearish across all measured timeframes. Momentum indicators show no credible reversal signal, and price continues to press lower within a narrow band. The proximity to oversold conditions on the daily RSI is the only technical factor that moderates aggressive short positioning.
Still, an oversold market can always become more oversold. The snap-back risk rises with each session below 30. Positioning in either direction demands discipline. Volatility is moderate but not extreme. The next meaningful catalyst — whether macro or company-specific — will likely define whether $80 holds as support or becomes the next line of failure.


 English (US) ·