
 2 hours ago
14
2 hours ago
14

Nike, Inc. stock is firmly in bearish territory as of late July 2026. Closing at $41.70 on July 24, NKE sits well below its key moving averages. Strategic uncertainty over China and a counterfeit goods incident in Vietnam add further weight to an already fragile chart.
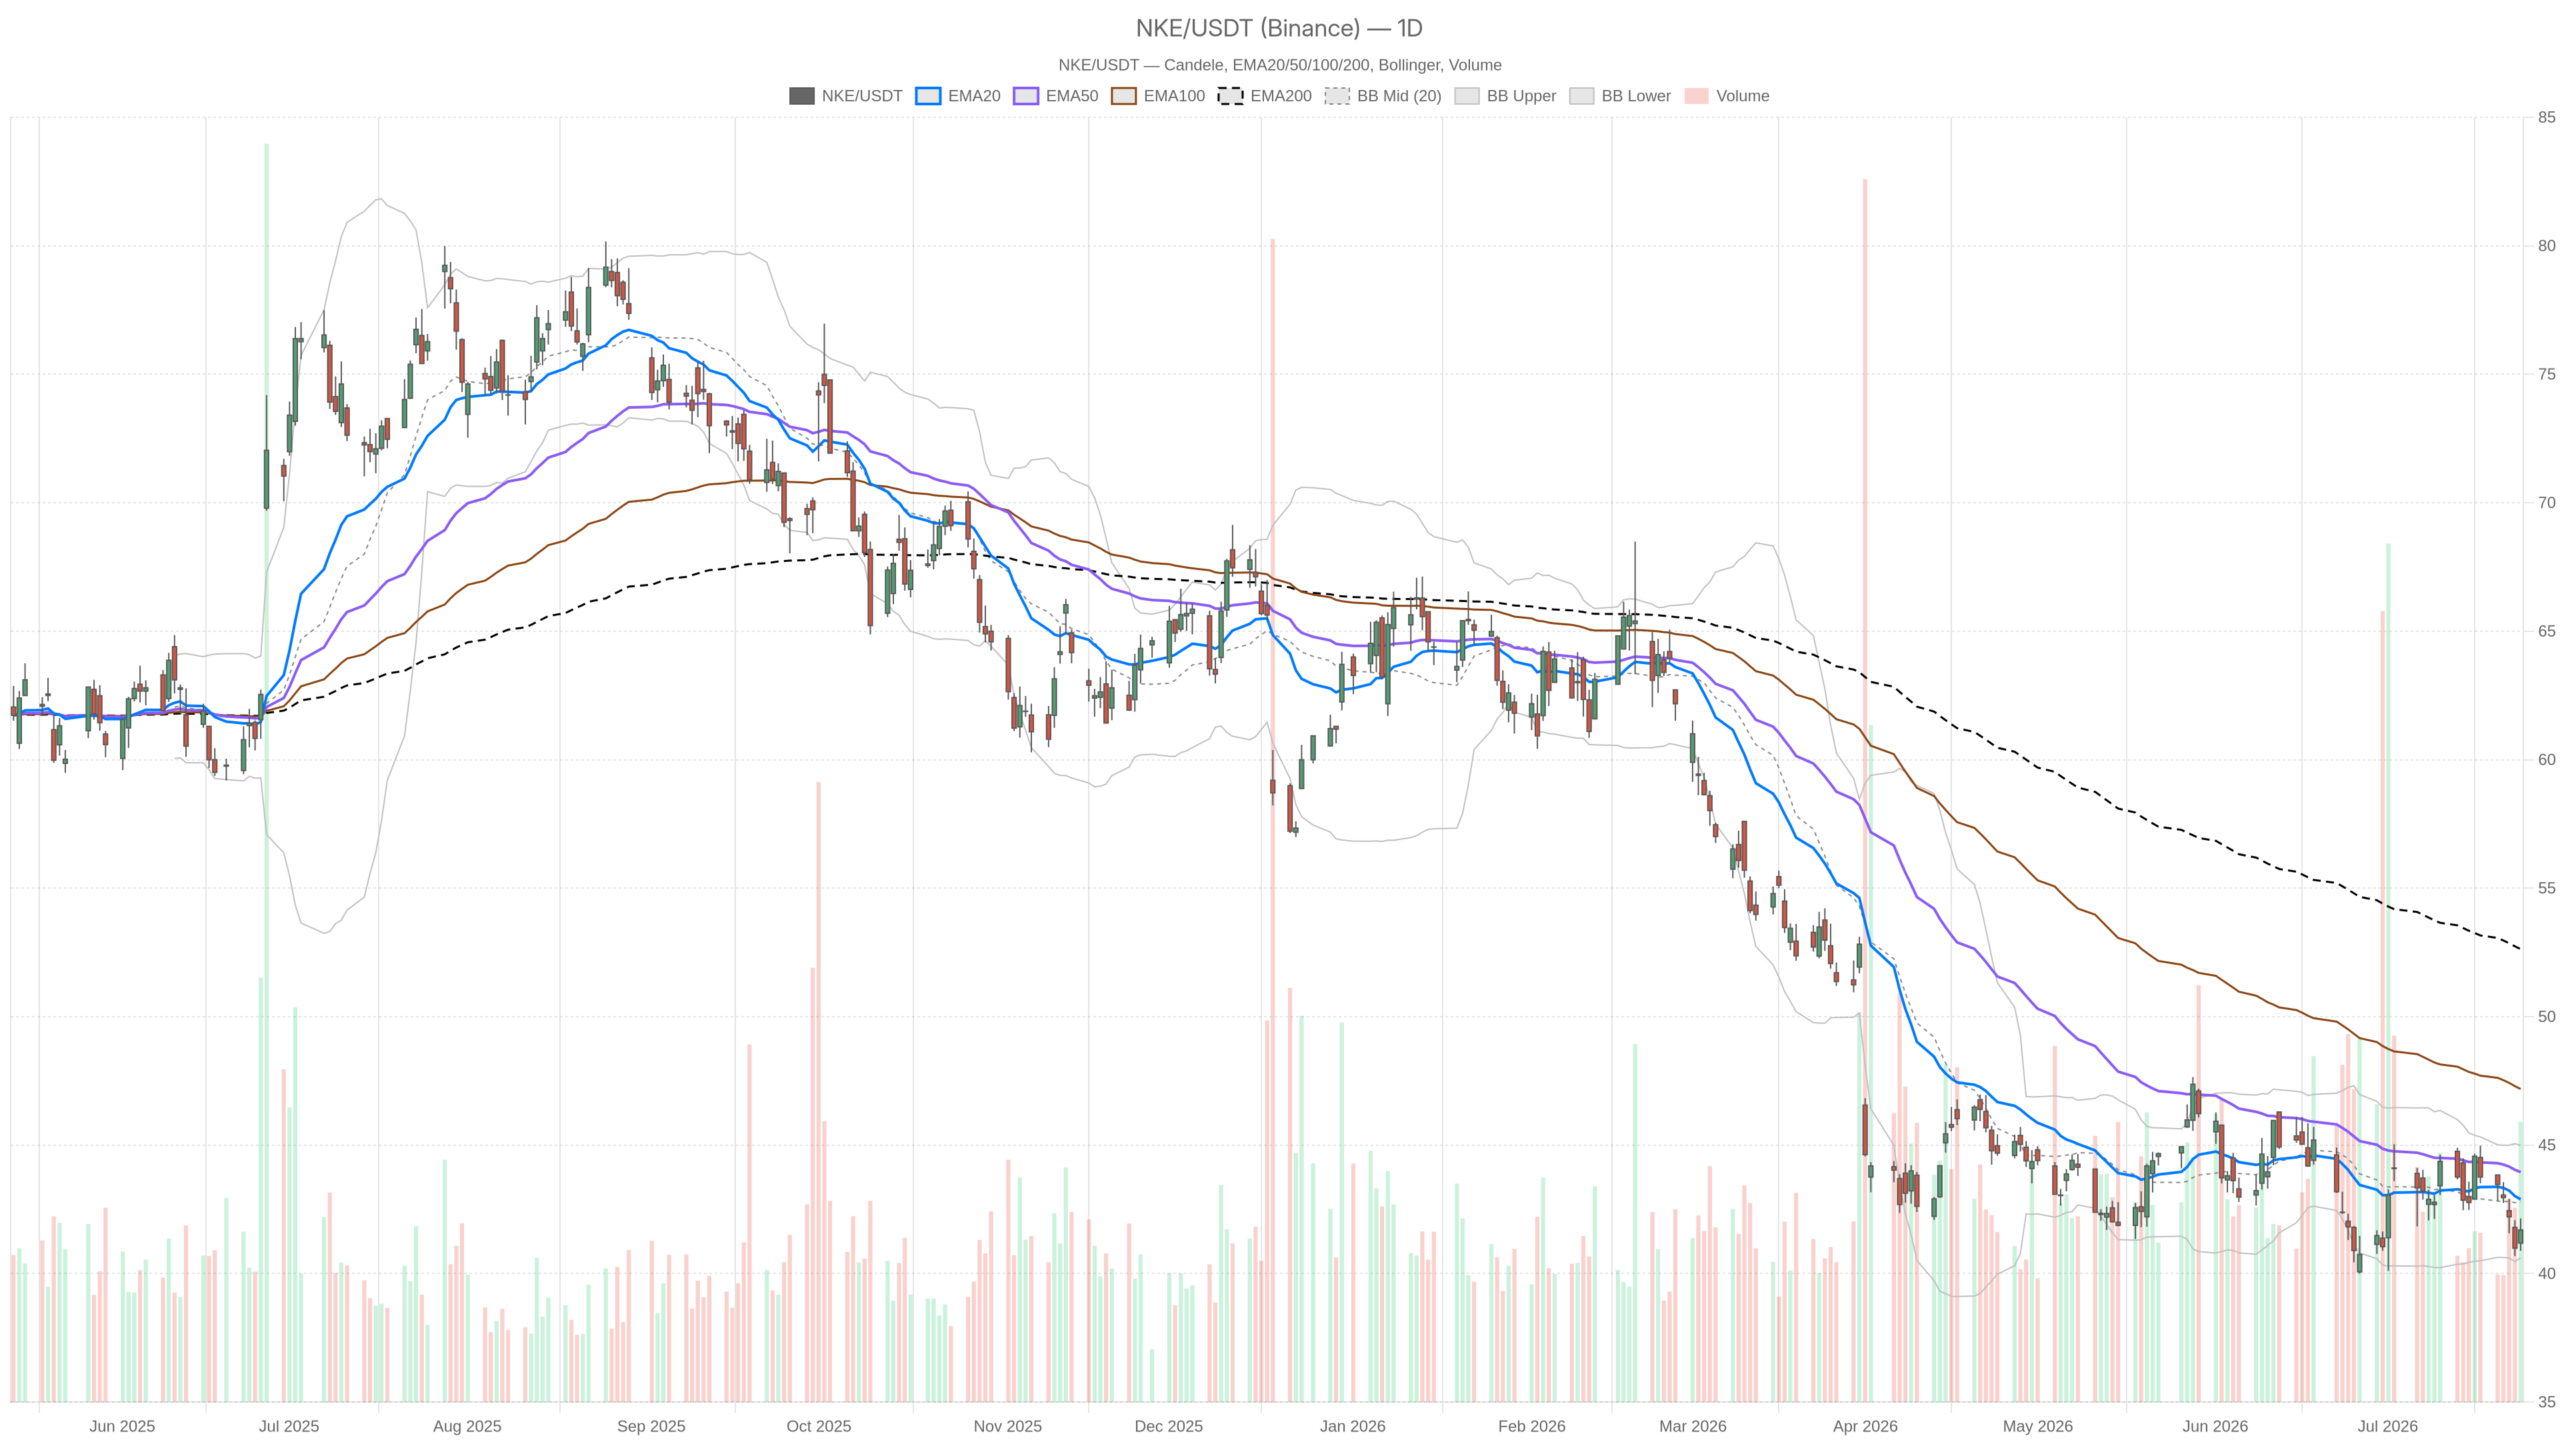 NKE — daily chart with candlesticks, EMA20/EMA50 and volume.
Key takeaways
- NKE closed at $41.70 on July 24, 2026, below the daily EMA20 ($42.89), EMA50 ($43.95), and EMA200 ($52.63).
- The daily RSI reads 43.25 — subdued but not oversold, confirming no technical floor has formed.
- The MACD remains negative with the line at -0.38 below the signal at -0.23.
- Nike will end all online sales through distributor Pou Sheng in China from January 1, 2027.
- Vietnamese authorities discovered nearly 50,000 pairs of allegedly fake Nike shoes in a Ho Chi Minh City factory raid.
Daily Timeframe Sets a Clear Bearish Bias for Nike, Inc. Stock
Nike, Inc. stock is in a firmly bearish daily configuration. Price sits below all three major moving averages, and no momentum reversal signal is visible.
The daily chart leaves little room for ambiguity. NKE closed at $41.70, below both the EMA20 at $42.89 and the EMA50 at $43.95. Meanwhile, the EMA200 sits even further above at $52.63. This stacking of price below all major moving averages is a classic bearish configuration.
The daily RSI at 43.25 reflects subdued momentum. Notably, it is not oversold — which is itself a warning sign. There is no technical floor being built here. Instead, the stock is caught in a slow, grinding decline.
The MACD reinforces this reading. The line at -0.38 sits below the signal at -0.23, with the histogram printing at -0.15. Bearish pressure has not yet exhausted.
Meanwhile, Bollinger Bands show the mid-band at $42.80, with price trading near the lower band at $40.61. The close of $41.70 is hugging the lower half of the channel. This is not a breakout setup. It is a stock struggling to hold above the lower boundary. The daily ATR of $1.35 confirms that intraday swings remain meaningful.
Pivot analysis adds precision. The daily pivot point sits at $41.58, with R1 at $42.27 and S1 at $41.01. NKE closed just above its pivot at $41.70. However, given the overall bearish context, this is a fragile hold rather than a sign of strength.
Hourly Structure Confirms Weakness, With One Minor Nuance
The hourly chart broadly reinforces the bearish outlook for Nike, Inc. stock. However, very short-term selling momentum shows tentative signs of deceleration.
Price closed at $41.61 on the last hourly candle. It sits below the H1 EMA20 at $41.77, the EMA50 at $42.35, and the EMA200 at $43.10. This is a clean bearish stack on the hourly timeframe. No meaningful recovery attempt is visible in the recent structure.
The H1 MACD introduces a minor nuance. The MACD line at -0.26 remains below zero. Still, the histogram has turned positive at +0.13. This means the gap between the MACD line and signal is narrowing. It is not a bullish signal, but it does suggest that very short-term selling momentum may be decelerating slightly.
The H1 RSI at 44.64 mirrors the daily reading. It remains subdued, drifting below the 50 midline, and offers no bullish divergence. The hourly Bollinger mid-band sits at $41.55, with price clustered just above it. The hourly ATR of $0.40 points to modest intraday volatility. Overall, the hourly picture does nothing to challenge the daily bearish bias. It merely hints that an extremely short-term bounce could materialise before the next leg lower.
15-Minute Context: Execution Zone Near Neutral
The 15-minute chart signals a neutral consolidation zone for Nike, Inc. stock. Directional conviction is absent on this shorter timeframe.
On the 15-minute timeframe, the regime is flagged as neutral. The RSI at 47.08 is centred around the midline. The MACD histogram is fractionally negative at -0.02 — essentially flat. Meanwhile, the EMA20 at $41.75 and EMA50 at $41.65 sit very close to each other and to current price. This represents a short-term consolidation zone rather than a directional commitment.
For traders looking at entry context, the 15m pivot at $41.76 defines the immediate range. R1 sits at $41.93 and S1 at $41.44. A break below $41.44 would likely accelerate toward the daily S1 at $41.01. In contrast, any push above $41.93–$42.07 would encounter upper Bollinger Band resistance. Heavier supply overhead on the hourly and daily charts then awaits.
Fundamental Backdrop: China Pivot and Operational Reset Add Strategic Risk
Strategic uncertainty around Nike, Inc. stock extends beyond the chart. The China distribution pivot and a Vietnam counterfeit incident are compounding bearish pressure.
The technical weakness does not exist in isolation. CEO Elliott Hill outlined a broad operational transformation following what he described as a significant progress period in fiscal 2026. Yet the market’s response suggests investors remain sceptical about execution timelines. The language of “strengthening the foundation” is not the language of a company delivering near-term earnings momentum.
Meanwhile, the China pivot is arguably the most consequential development. Nike has informed distributor Pou Sheng that all online sales of Nike products in mainland China will end from January 1, 2027. This channel accounted for 15% of Pou Sheng’s 2025 revenue. One analyst has already characterised this as a high-stakes gamble. The longer-term rationale may be sound, but the short-term revenue displacement is real and unresolved.
On top of this, Vietnamese authorities discovered nearly 50,000 pairs of allegedly fake Nike shoes being prepared for export. The raid occurred at a Ho Chi Minh City factory. While this is not a direct operational failure for Nike, it adds reputational noise. It also highlights supply chain vulnerabilities in a region critical to Nike’s manufacturing footprint.
Bullish Scenario for Nike, Inc. Stock: What Would Need to Change
For a credible bullish case to emerge, Nike, Inc. stock must reclaim the daily EMA20 at $42.89 with sustained conviction. Without this, the bearish structure remains intact.
A close above $42.89 followed by a confident hold would begin to challenge the bearish structure. The daily MACD histogram turning positive — ideally with a bullish crossover — would add meaningful confirmation. On the fundamental side, any concrete signs that the China transition is proceeding without significant revenue disruption could shift sentiment. Positive commentary from management on forward guidance would also help. Evidence that the operational reset is translating into margin improvements would be the kind of catalyst the stock needs. In the current environment, however, neither technical nor fundamental conditions appear imminent.
Bearish Scenario for Nike, Inc. Stock: The Path of Least Resistance
The bearish path for Nike, Inc. stock remains the path of least resistance. A break below the daily pivot exposes $41.01 and potentially the lower Bollinger Band at $40.61.
A failure to hold above the daily pivot at $41.58 would, in turn, expose S1 support at $41.01. Beyond that, the lower Bollinger Band at $40.61 comes into play. Given the distance between current price and the EMA200 at $52.63, there is no structural support from long-term trend buyers at current levels. The China strategy overhang could weigh further. The market may price in a wider revenue gap as the January 2027 deadline approaches.
In contrast to any tentative hourly stabilisation, the daily regime remains firmly bearish. As long as NKE trades below all three major EMAs without a meaningful catalyst, directional pressure stays to the downside.
Closing Assessment
Nike, Inc. stock remains a technically damaged chart navigating a complex fundamental transition. The daily bearish regime, confirmed by the hourly structure, keeps the stock under pressure. Volatility, as measured by the daily ATR of $1.35, remains present. Moves can be sharp even within a downtrend. The 15-minute neutral reading suggests a temporary pause rather than a genuine shift in direction. Traders and investors should treat any near-term bounce with caution. Until NKE reclaims $42.89 or the fundamental narrative around China and operational delivery shifts materially, the risk-reward balance skews against the bulls.
FAQ
What is the current price of Nike, Inc. stock?
Nike, Inc. stock closed at $41.70 on July 24, 2026, its most recent trading session at the time of analysis.
What are the key support levels to watch for NKE?
The daily pivot S1 sits at $41.01. The lower Bollinger Band at $40.61 serves as the next major support below that level.
Is Nike, Inc. stock technically oversold?
No. The daily RSI reads 43.25, which sits below the 50 midline but remains well above traditional oversold territory. This means no technical floor has formed yet.
What fundamental factors are weighing on Nike, Inc. stock?
Nike’s decision to end all online sales via distributor Pou Sheng in China from January 1, 2027, is creating revenue uncertainty. Separately, nearly 50,000 pairs of allegedly fake Nike shoes were seized in a Vietnamese factory raid, adding reputational noise.
Disclaimer: This article is for informational purposes only and does not constitute financial advice, an investment recommendation, or a solicitation to buy or sell any financial instrument or cryptocurrency. The analysis provided is not indicative of future results. Investing in crypto assets and financial markets carries a high risk of capital loss. Always do your own research (DYOR) and consult a qualified financial advisor before making any decision.
Article produced with the assistance of artificial intelligence and reviewed by the editorial team.









 English (US) ·