
 1 month ago
45
1 month ago
45

Shopify Stock remains under decisive pressure after a double‑digit post‑earnings slide. The daily trend is bearish, momentum is soft, and price closed beneath the lower Bollinger Band. Therefore, the base case is a bearish bias, with rebound attempts likely to meet supply near nearby pivots.
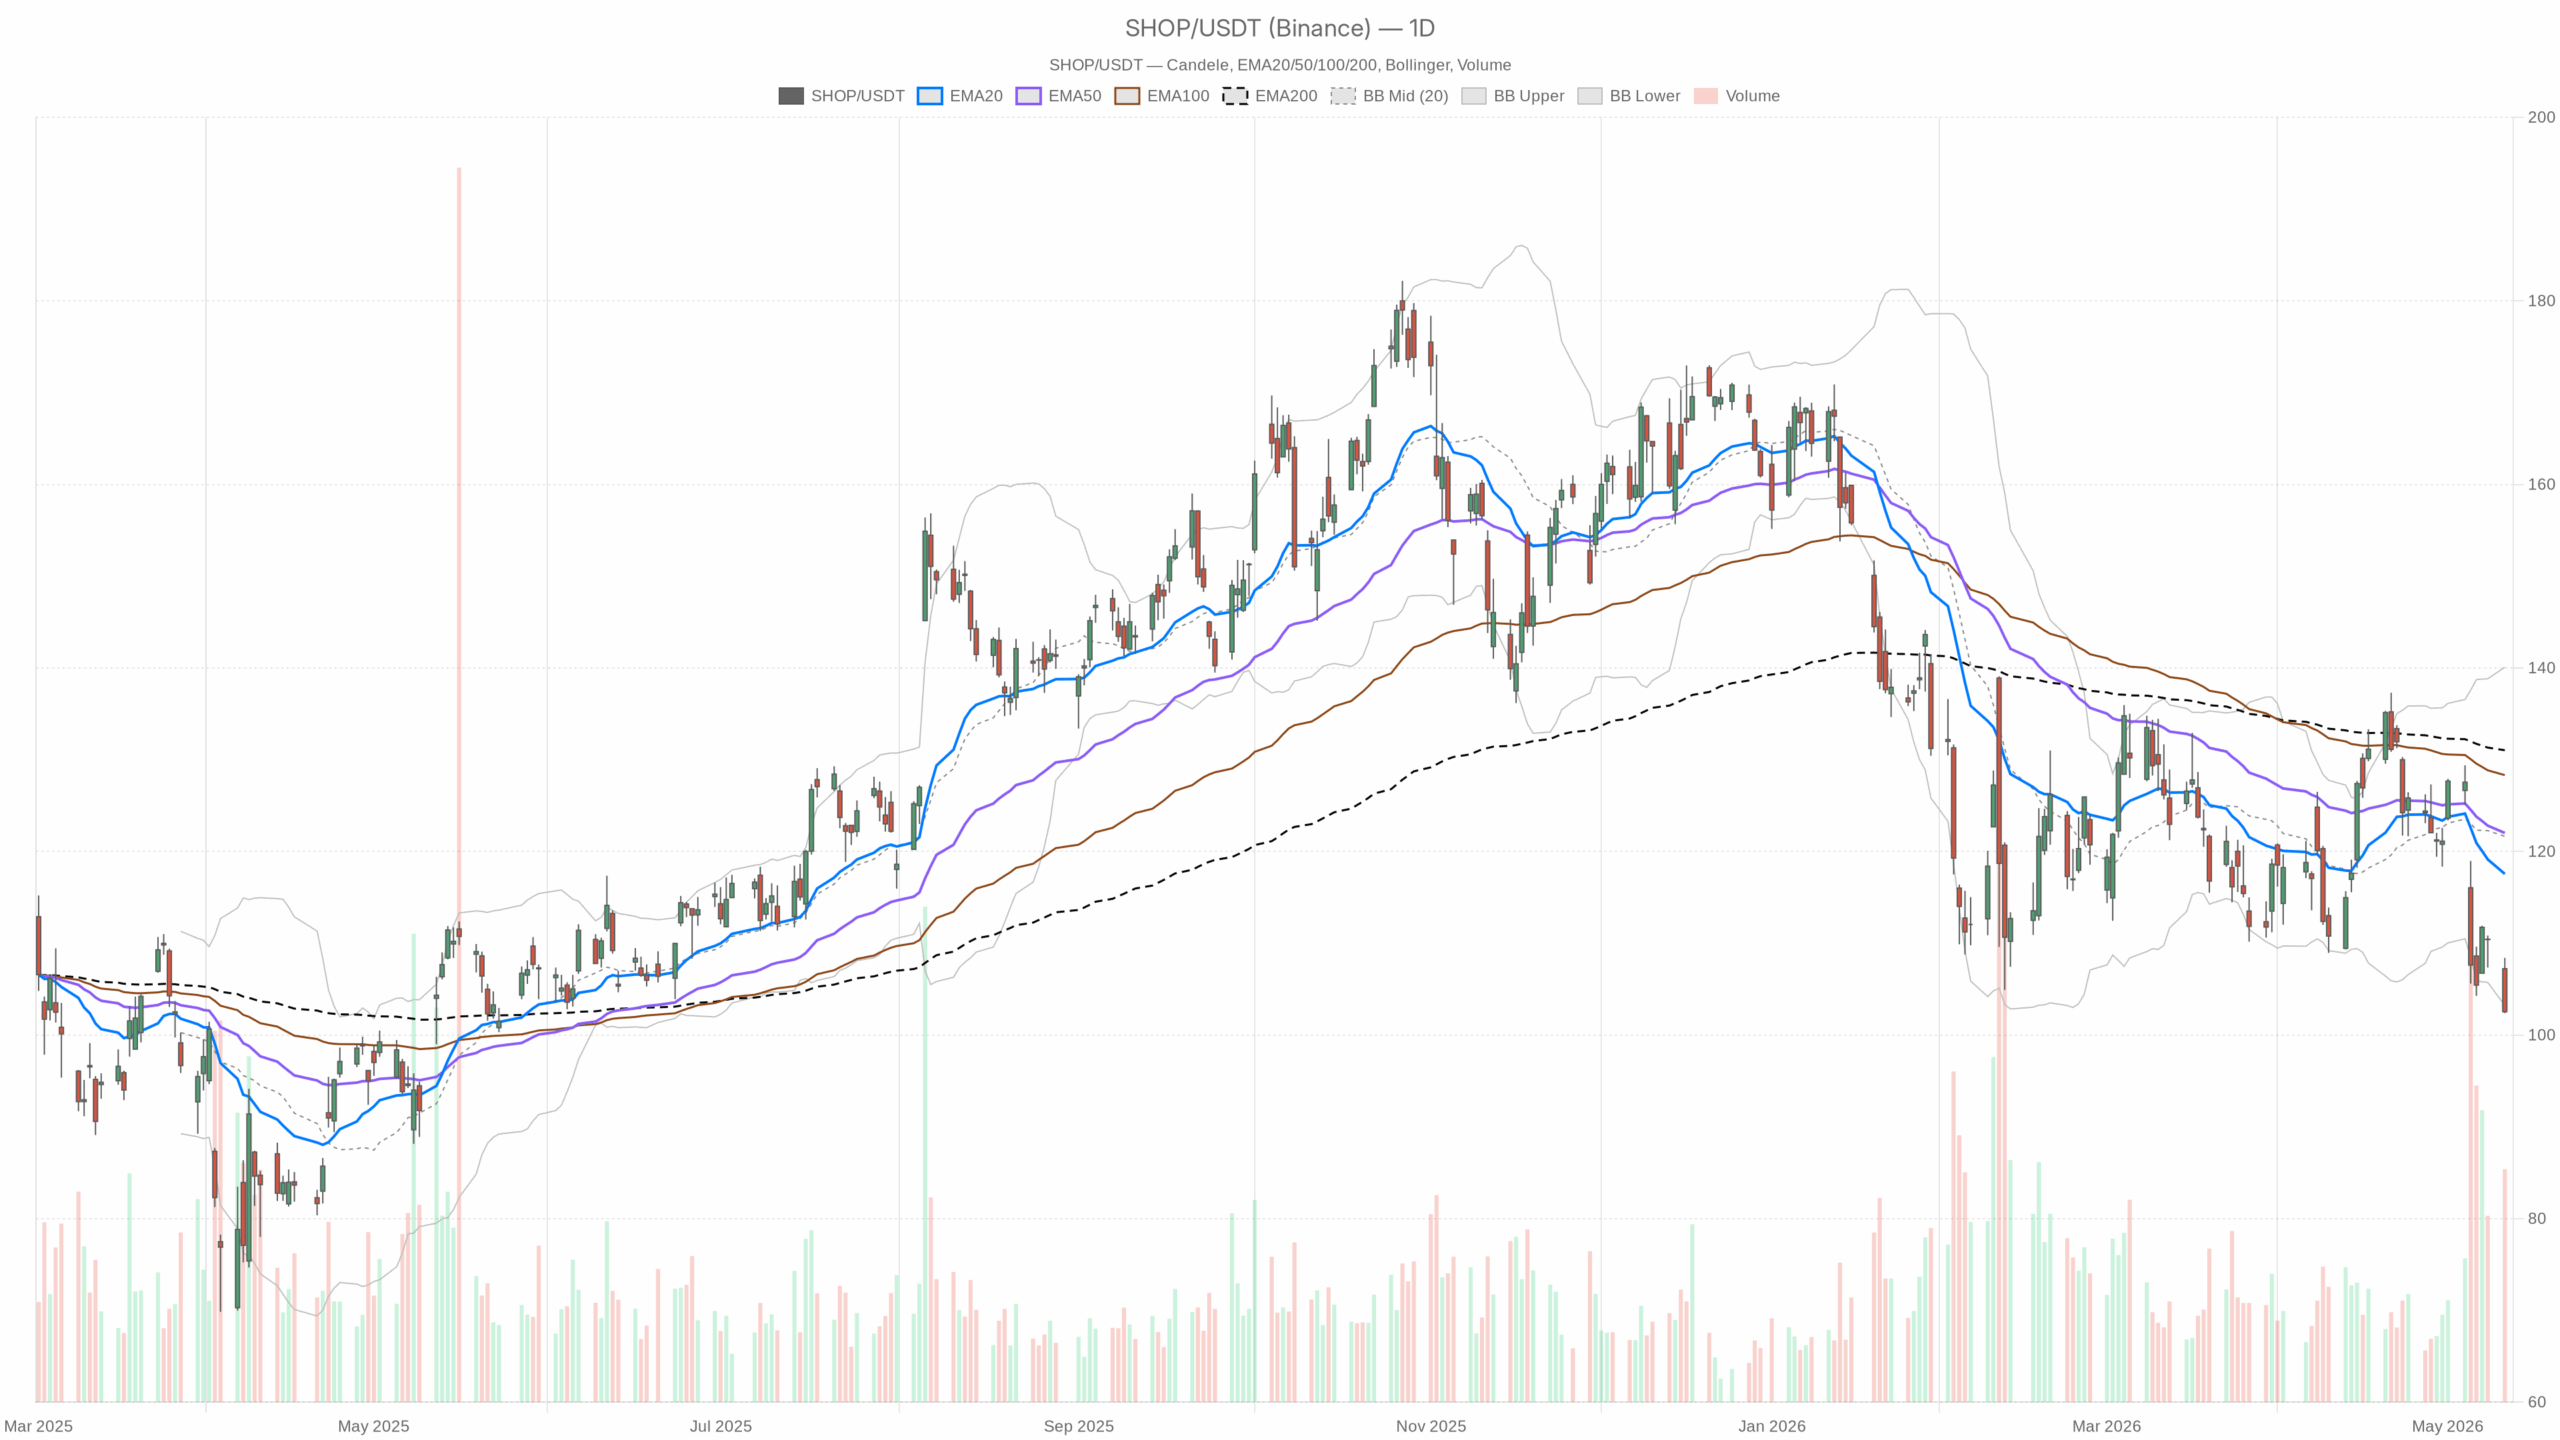 SHOP — daily chart with candlesticks, EMA20/EMA50 and volume.
News Flow and Tape Context for Shopify Stock
Meanwhile, the news flow has skewed negative despite solid headline results. Shares fell roughly 13.4% after Shopify’s Q1 beat and a strong Q2 growth outlook, according to recent coverage — a risk‑off reaction that reinforces the technical damage. In contrast, Oppenheimer maintained an Outperform rating while trimming its price target to 175. That is supportive longer term, but near‑term tape action still dominates.
Shopify Stock Daily Chart (D1): Trend and Momentum
On the D1 timeframe, SHOP closed at 102.54 after a 102.39–108.41 range. Price sits well below the 20/50/200‑day EMAs at 117.56/122.02/131.04. This negative alignment confirms a downtrend, and rallies face overhead supply.
RSI(14) is 35.34. Momentum is weak, near oversold but not capitulative. MACD line −3.67 vs signal −1.35 with histogram −2.32 shows downside momentum remains dominant and has not turned.
Notably, Bollinger Bands stand at mid 121.65, upper 140.08, and lower 103.23. The close under the lower band highlights stretched conditions that can persist, yet are prone to snap‑back bounces. ATR(14) at 6.45 signals elevated daily volatility. Daily pivots are PP 104.45, R1 106.50, and S1 100.48. Trading below PP keeps bears in control, and S1 is the near‑term line to watch. Regime: bearish — the primary bias is down.
Intraday Context (H1): Confirmation and Levels
At the same time, the 1‑hour chart prints 102.52 with EMAs 20/50/200 at 106.87/111.63/118.99. Price sits firmly below a falling stack, confirming the D1 downtrend on a tactical horizon.
RSI(14) is 34.12, reflecting bearish momentum with only tentative stabilization. MACD line −2.48 vs signal −2.22 and histogram −0.25 are negative but flattening, hinting at reduced downside speed rather than a turn. Bollinger Bands are mid 107.58, upper 113.26, and lower 101.90, with price near the lower band.
Meanwhile, ATR(14) at 1.94 indicates brisk intraday swings that can overshoot nearby levels. H1 pivots sit at PP 102.89, R1 103.38, and S1 102.02. Trading below PP keeps the intraday bias lower, and S1 is the first support on dips.
Execution Layer (M15): Short‑Term Signals
The 15‑minute execution context shows bears easing slightly into support. EMAs 20/50/200 at 104.01/105.77/111.97 remain above price, which preserves a bearish near‑term structure.
RSI(14) at 31.75 is in oversold territory that can fuel a tactical bounce. MACD line −1.02 vs signal −1.08, with histogram +0.07, marks a minor positive inflection and fading sell pressure. Bollinger Bands are mid 103.79, upper 105.34, and lower 102.25, with price hugging the lower band. ATR(14) at 0.55 implies tight execution risk per bar despite wider session ranges. M15 pivots are PP 102.61, R1 102.83, and S1 102.30 — immediate levels for entries and risk control around the 102–103 zone.
Scenarios for Shopify Stock
Bullish Scenario
A constructive turn would start with a D1 close back inside the Bollinger envelope above 103.23 — a sign of mean reversion after the lower‑band break. Next, reclaiming the daily PP at 104.45 and the H1 PP/R1 band at 102.89/103.38 would signal an early shift toward dip‑buying interest. Firming H1 momentum — RSI lifting and MACD crossing up — would add confirmation, improving the odds of a push toward 106.50 (D1 R1). Short‑term, the M15 PP/R1 at 102.61/102.83 offers a first test of whether bounces can sustain. A hold above would signal buyers are stepping in.
Bearish Scenario
On the other hand, the bearish scenario stays in control while price holds below 104.45. A clean break under H1 S1 at 102.02 and the D1 S1 at 100.48 would open another leg lower, consistent with the negative EMA stack and weak RSI. Notably, ATR remains elevated on D1 at 6.45, so downside breaks could be fast and disorderly. With price already below the daily lower band, failure to re‑enter the band would validate trend continuation, keeping sellers active on rallies.
Bottom Line on Shopify Stock
Overall, SHOP stock trades with a bearish bias, high volatility, and mixed but stabilizing short‑term momentum. Positioning remains tactical: swings are wide, and levels can break quickly. Until the daily chart repairs above key pivots, uncertainty favors defense and disciplined use of intraday levels.


 English (US) ·