
 2 months ago
48
2 months ago
48
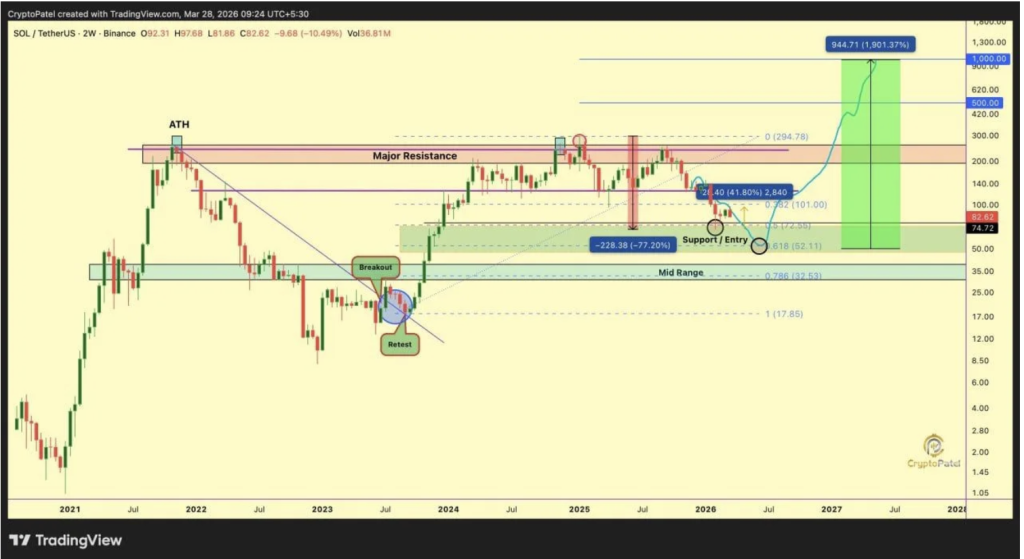
- Solana dropped roughly 77% and is now testing a key support zone near $75
- Long-term analysis points to accumulation, while short-term charts remain bearish
- The $71–$77 range is critical, with resistance near $84–$87 limiting upside
Solana has found itself back near a key support area after a pretty steep drop from its earlier highs. From around $250 down to below $80, that’s roughly a 77% correction, which, yeah… is not small by any measure. It’s the kind of move that tends to shake out weaker hands, while others start looking at it as opportunity instead.
Right now, price is hovering just above an important zone, and that’s where things start to split. Some see this as a potential base forming, while others aren’t fully convinced yet. The market feels undecided, maybe even a bit tense, like it’s waiting for the next push.
Long-Term View Points to Accumulation
Crypto Patel’s higher timeframe chart leans toward a more optimistic outlook, at least over the long run. He highlights the $45 to $75 range as a key accumulation zone, with the 0.618 Fibonacci level sitting around $52 adding weight to that idea. That level tends to matter in these kinds of retracements, not always, but often enough.
Interestingly, the sentiment shift is part of his argument. When SOL was above $250, everyone seemed bullish, almost loudly so. Now, below $80, things have gone quiet, and that silence, according to Patel, might actually signal opportunity rather than risk. It’s a contrarian take, not focused on short-term moves, but on positioning during weakness.
He even outlines long-term targets as high as $500 and $1,000, which, to be fair, are quite ambitious. Those levels suggest a full recovery and then some, so they’re more about conviction than immediate expectation. And instead of waiting for perfect timing, he’s leaning into averaging down, adding more if price drops further.
Short-Term Charts Tell a Different Story
On the flip side, the short-term picture isn’t exactly reassuring. A 1-hour chart shared by More Crypto Online shows Solana breaking below an upward trendline, which usually signals weakening structure. After that break, price didn’t stabilize, it continued lower, suggesting momentum is still leaning bearish in the near term.
The chart identifies a resistance zone between roughly $84 and $87, where price could face rejection if it tries to bounce. So far, it hasn’t managed to reclaim that area, which keeps pressure on the downside. At the same time, a broader support zone between about $71 and $77 is now the key area to watch.
Momentum Weakens as Support Gets Tested
What makes this setup a bit tricky is that previous support has already failed. That rising trendline that once held price up is now gone, and once that kind of structure breaks, it tends to shift sentiment quickly. Instead of acting as a floor, it becomes a sign that momentum has faded.
The current move even suggests a possible continuation lower, with some analysts labeling it as part of a larger downward wave. If that plays out, SOL could drift into that mid-$70 support band before any meaningful reaction shows up. It’s not guaranteed, but it’s a scenario that’s hard to ignore.
A Market Caught Between Two Narratives
So right now, Solana is sitting in an interesting spot, caught between a long-term accumulation narrative and short-term bearish pressure. If buyers step in around the current support and hold it, there’s room for a bounce, maybe even a slow recovery. But if that level breaks, things could get a bit heavier before stabilizing.
For now, the key is how price reacts around this zone. Holding support could rebuild confidence over time, but staying below resistance keeps the downside scenario alive. It’s one of those moments where both sides have a case, and the market hasn’t fully decided yet.
Disclaimer: BlockNews provides independent reporting on crypto, blockchain, and digital finance. All content is for informational purposes only and does not constitute financial advice. Readers should do their own research before making investment decisions. Some articles may use AI tools to assist in drafting, but every piece is reviewed and edited by our editorial team of experienced crypto writers and analysts before publication.


 English (US) ·