
 1 hour ago
28
1 hour ago
28
Key Highlights
- SOL price fluctuated between $101 and $105, registering approximately 4-5% gains over 24 hours
- Crypto analyst Ali Charts pinpointed $105 as the critical resistance threshold
- Breakthrough above $105 with sustained closing could trigger movement toward $130
- Net inflows into Solana ETFs totaled $836,930 on September 16
- Technical indicators on the weekly timeframe suggest a potential SMA crossover that could signal major price action
Solana maintained its position above the psychologically significant $100 threshold on Wednesday following a roughly 5% increase over the preceding 24-hour period. During this analysis, SOL was exchanging hands near $101.32, demonstrating stronger performance compared to the wider cryptocurrency marketplace.
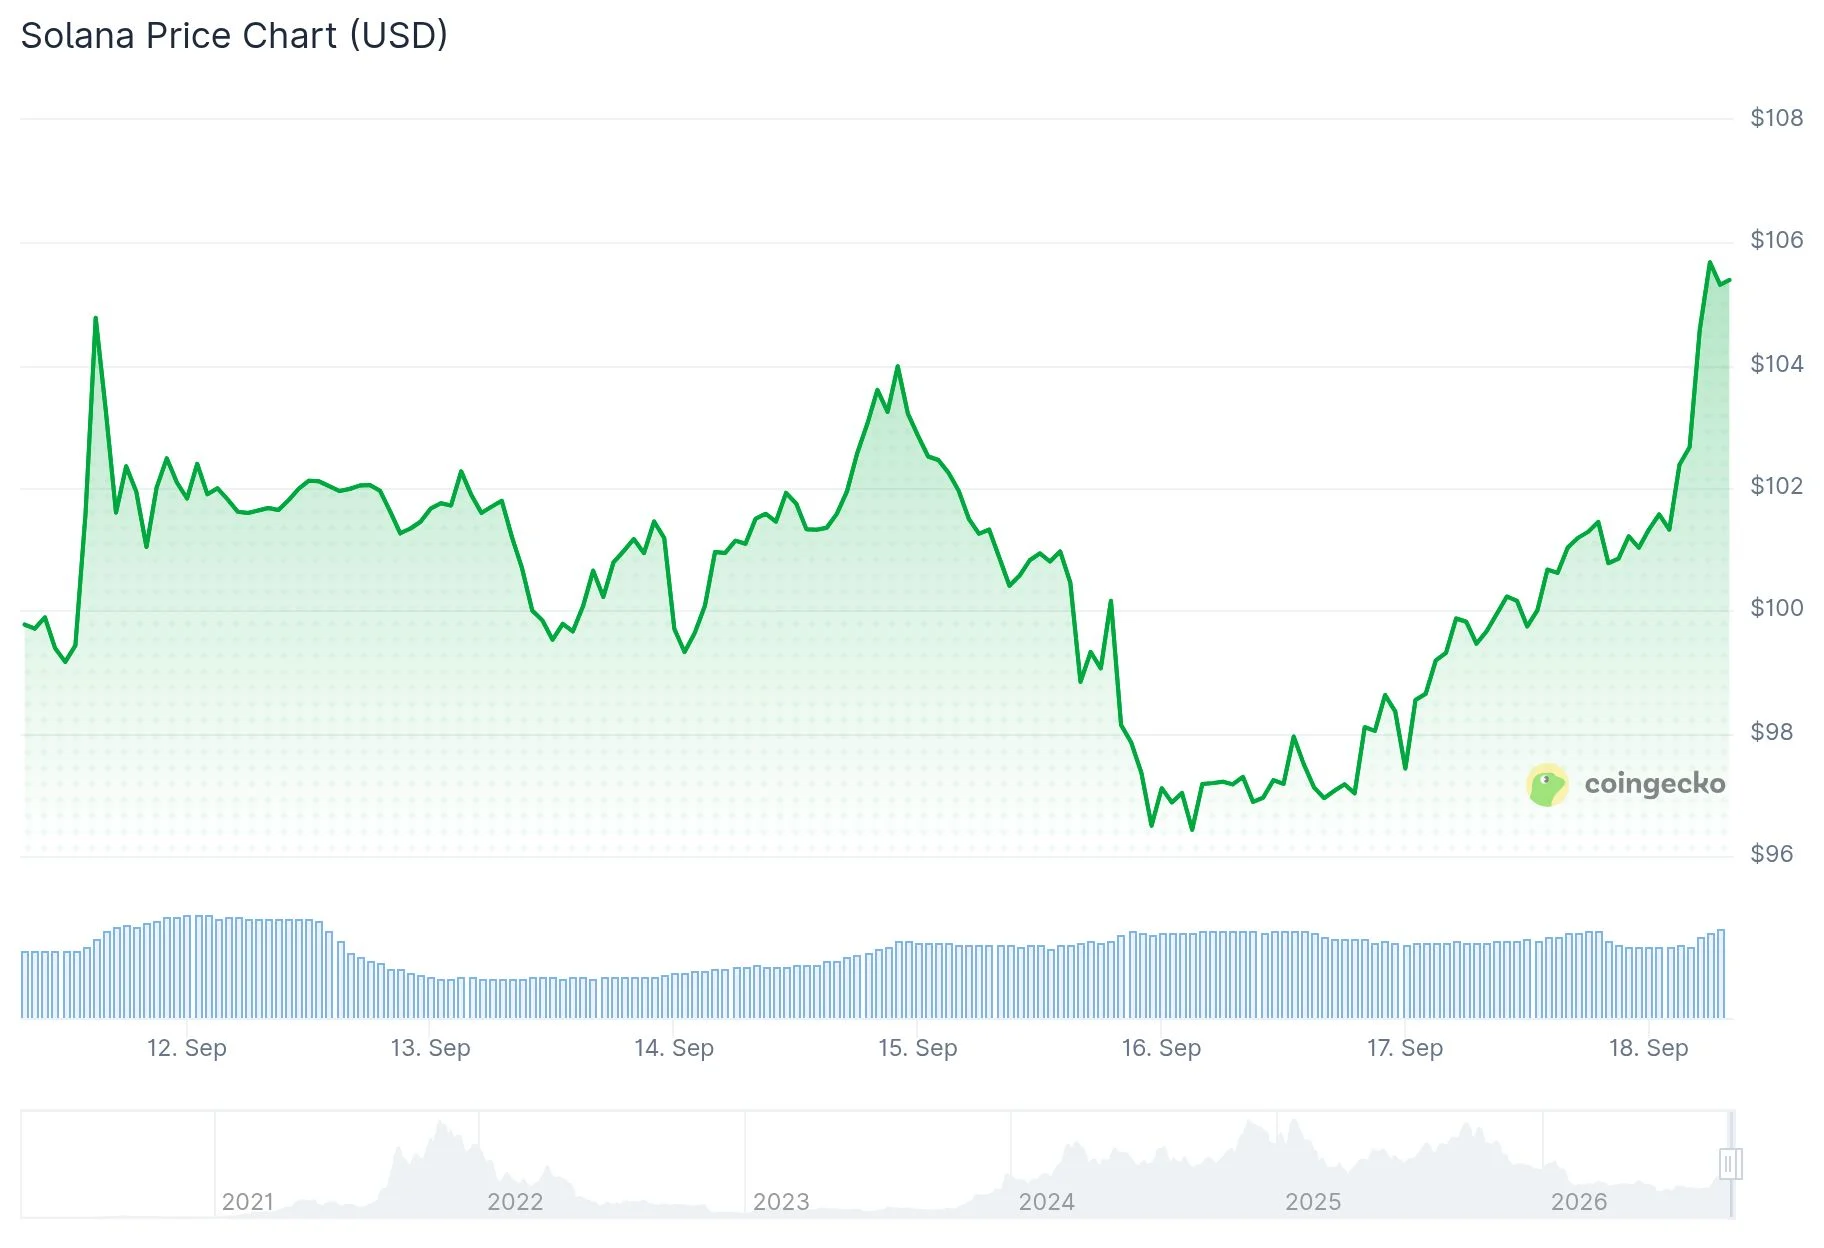 Solana (SOL) Price
The aggregate cryptocurrency market capitalization experienced a 2.13% uptick, reaching $2.63 trillion. Bitcoin hovered around the $76,000 mark while Ethereum traded near $2,450 during this timeframe.
Technical analyst Ali Charts identified a bull flag formation emerging on Solana’s four-hour timeframe. This chart pattern materialized following an earlier upward price movement, subsequently entering a consolidation phase near the $101 region.
According to Ali Charts, $105 represents the pivotal resistance threshold requiring monitoring. In a social media update on X, the analyst stated: “A sustained close above it could confirm the bullish breakout and open the door to a rally toward $130.” The analyst cautioned that any upward movement past $105 lacking a decisive close might constitute a false breakout scenario.
Technical momentum indicators showed SOL’s MACD line positioned at -0.10, trading above the signal line at -0.55, with the histogram displaying a positive 0.44 value indicating strengthening momentum. The Relative Strength Index advanced to 59.42, demonstrating increasing buying pressure while remaining below overbought conditions.
Exchange-Traded Fund Activity and Market Metrics
Investment flows into Solana-focused ETFs totaled $836,930 in net inflows on September 16, based on data from SoSoValue. Bitwise’s BSOL product captured the largest share with $2.69 million in incoming capital, while Grayscale’s GSOL experienced $1.85 million in capital withdrawals.
 ETF DATA: US spot @Solana ETFs saw $1.35M in net inflows yesterday, led by $BSOL, bringing the total net inflows to $1.38 billion.
Track here: https://t.co/8nZJxjLBBF pic.twitter.com/1cGBBbIzu8
— SolanaFloor (@SolanaFloor) September 16, 2026
Combined net assets held across the seven Solana ETF offerings climbed to $1.38 billion, representing 2.38% of SOL’s overall market capitalization. Trading volume for these products reached $51.57 million daily, with BSOL commanding the largest position at $945.76 million in assets under management.
In a separate analysis, Ali Charts presented an extended timeframe perspective on Solana’s blockchain data, observing that over 40 million SOL tokens have changed hands near the $100 price point, establishing what the analyst characterized as a substantial support foundation. According to Ali Charts, the weekly chart displays a cup-and-handle formation with a neckline positioned around $360.
Moving Average Convergence and Tokenized Asset Developments
Examining the weekly chart structure, analyst Trader Tardigrade drew attention to an impending convergence between Solana’s 100-period and 150-period simple moving averages. The analyst referenced historical occurrences where comparable crossovers preceded significant price appreciation. Tardigrade established an ambitious technical price objective of $1,000 per SOL, though this figure represents an individual trader’s forecast rather than widespread market consensus.
$SOL/weekly — Expansion Phase  #Solana came down from a downtrend and reached the base. The 100 SMA and 150 SMA converged and are now forming a crossover.
 Base formation complete
 SMA crossover forming
 Historical pattern: crossover = expansion
 This exact pattern… pic.twitter.com/KgFaBDhLfr
— Trader Tardigrade  (@TATrader_Alan) September 17, 2026
Developments in tokenization also accelerated on the Solana network. Solflare expanded its xStocks platform by incorporating more than 750 tokenized equity instruments, featuring shares from prominent companies including Nike, Disney, and Airbnb.
The Securities and Exchange Commission announced on September 17 a conditional five-year exemption designed to facilitate blockchain-based trading of tokenized stocks and securities, reducing certain conventional exchange and broker-dealer compliance requirements.
At the time of the subsequent market update, SOL was changing hands near $100.14 with 24-hour trading volume reaching $6.27 billion and a market capitalization of roughly $59 billion.
The post Solana (SOL) Eyes $130 Breakout as Critical Resistance Level Approaches appeared first on Blockonomi.







 English (US) ·