
 2 hours ago
8
2 hours ago
8
Key Takeaways
- SOL currently trades beneath the $65 threshold, positioned significantly below its 50-, 100-, and 200-day moving averages, signaling continued bearish pressure.
- Solana ETFs registered $794,270 in net inflows on Tuesday, though this comes after a hefty $6.52 million in outflows over the previous week, reflecting inconsistent institutional interest.
- Open Interest across SOL futures contracts has contracted to approximately $4.41–$4.57 billion from earlier peaks near $17 billion, indicating reduced trader leverage and participation.
- Exchange flow dynamics have shown improvement throughout March, with several recent trading sessions displaying moderate net inflows that hint at emerging accumulation patterns.
- Crypto analyst Ali Charts has identified a TD Sequential buy signal forming on SOL’s chart, suggesting potential upward movement toward the $77 resistance zone.
Solana continues to face persistent downward pressure spanning multiple weeks, with Wednesday’s trading activity offering little reprieve. The token is currently changing hands around the $64–$66 range, trading substantially below critical moving average benchmarks, while the route toward meaningful recovery remains lined with significant obstacles.
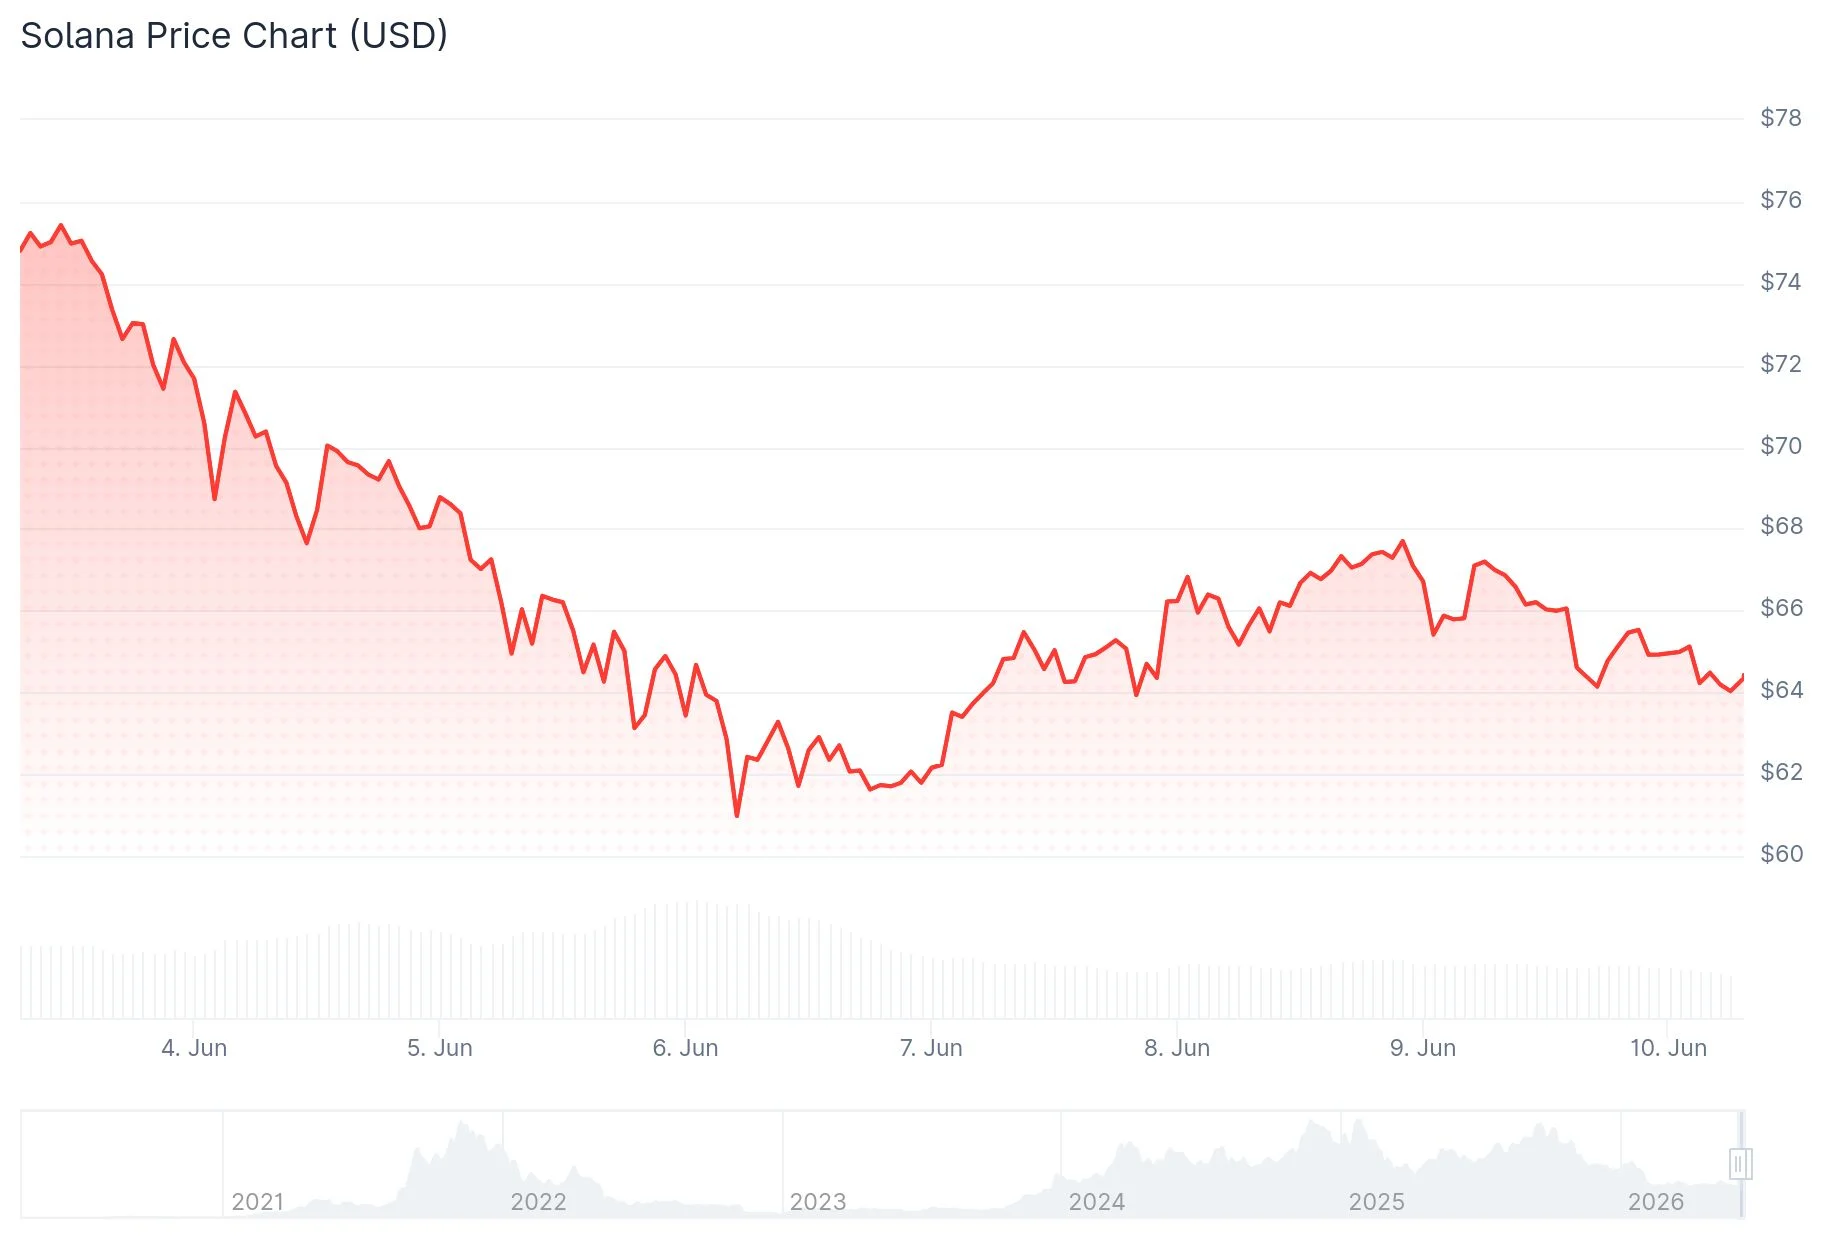 Solana (SOL) Price
The digital asset rebounded from Sunday’s low near $60.13, managing a brief recovery effort. However, this upward momentum has since fizzled out. The token continues trading beneath its 50-day EMA positioned at $80.25, the 100-day EMA at $87.22, and the 200-day EMA at $102.96. This configuration maintains the overall trend in decisively bearish conditions.
The nearest support level appears at $65.59, corresponding with the 0.236 Fibonacci retracement marker. Should this level fail, a demand zone exists between $63 and $64, with the crucial swing low at $60.13–$60.17 providing further backstop. Breaking beneath that foundation would bring the $59.11 level into focus, a price point last seen in December 2023. Further deterioration could expose the $51.28 area, approaching the psychologically significant $50 threshold.
Institutional Flows Remain Inconsistent
Regarding institutional activity, Solana-focused exchange-traded products captured $794,270 in inflows during Tuesday’s session. This followed Monday’s $471,650 in outflows. Examining a broader timeframe reveals additional complexity — the preceding week witnessed cumulative outflows totaling $6.52 million. Such volatility in weekly flows underscores wavering institutional confidence in the asset currently.
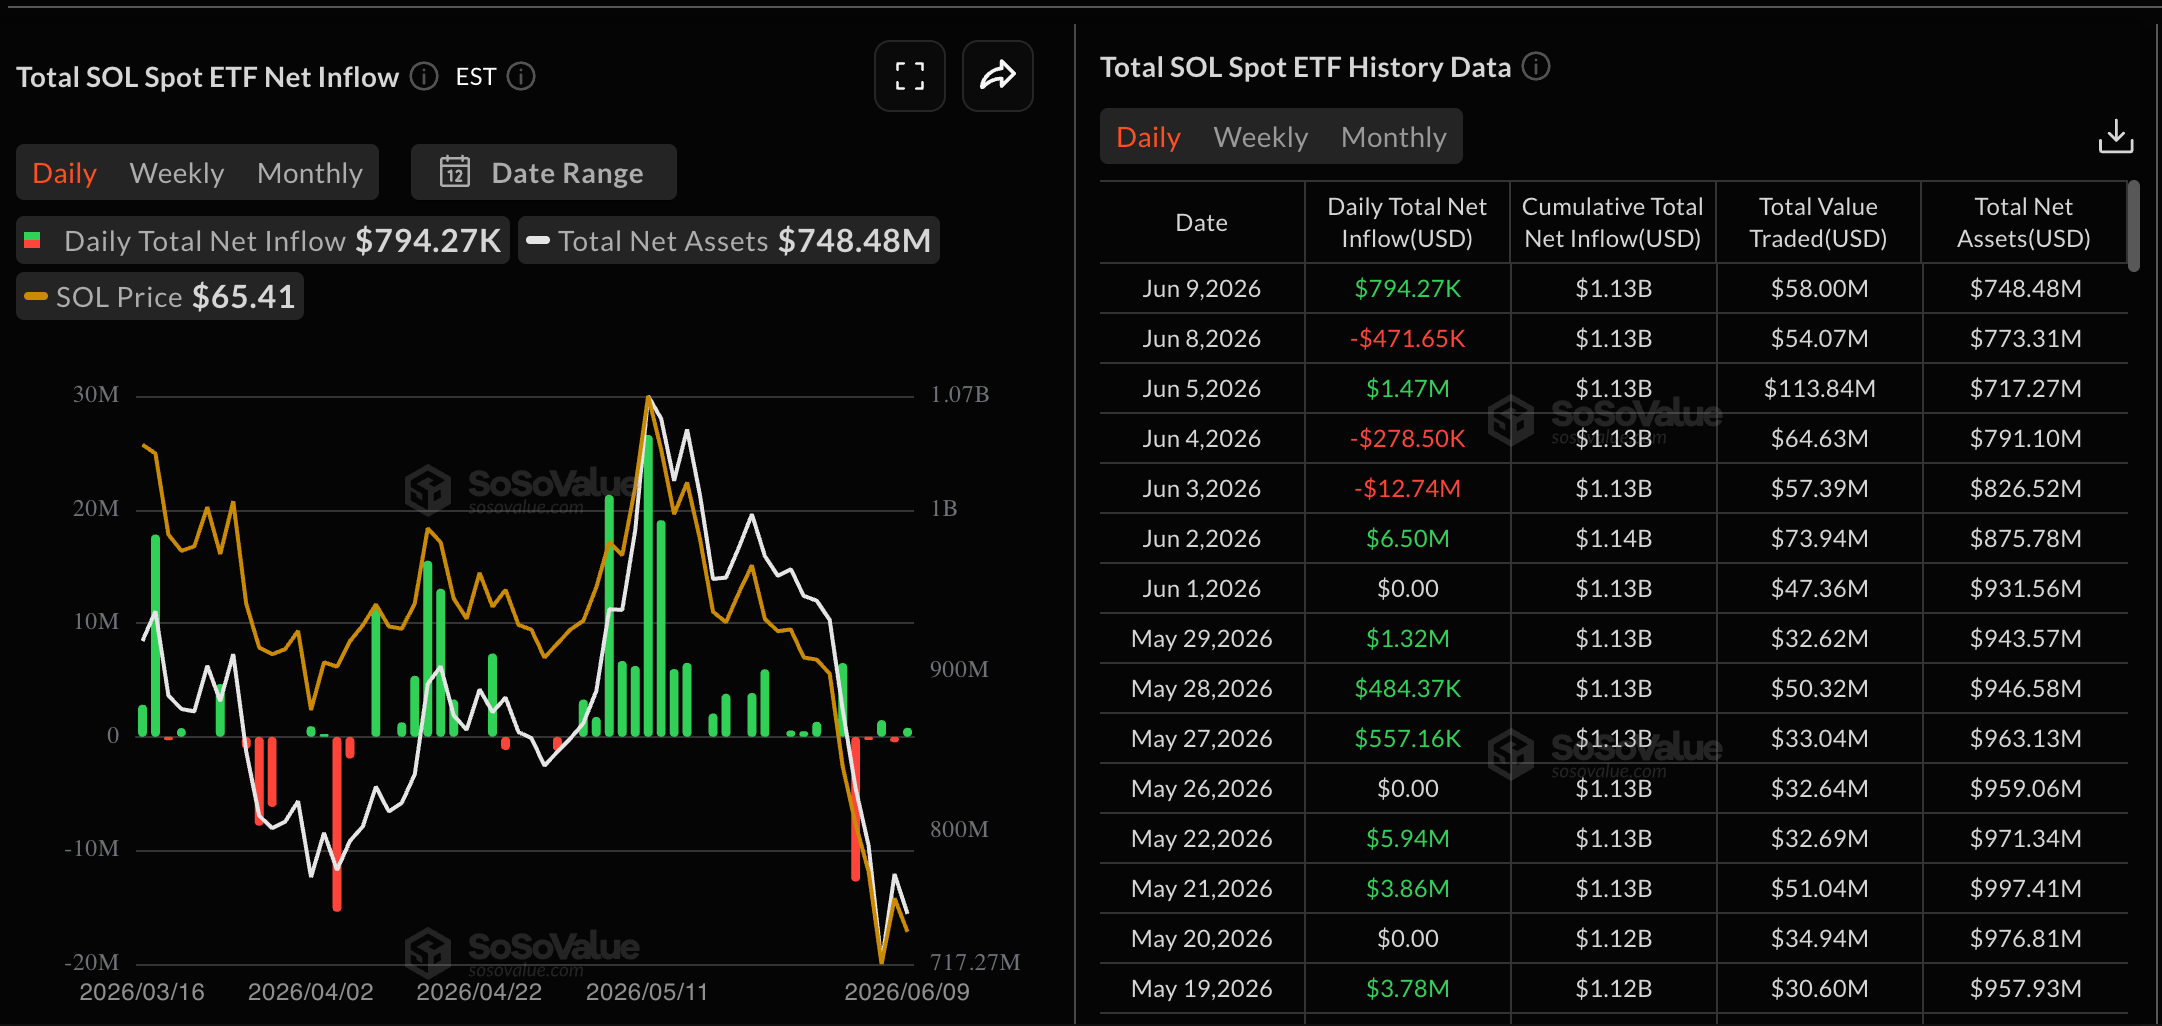 Source: SoSo Value
Retail engagement has similarly moderated. Funding rates, which registered -0.0325% on Sunday, normalized to approximately -0.0042% by Wednesday, indicating diminished leverage-driven selling activity. Nevertheless, Open Interest in SOL futures declined roughly 2% over the past day to $4.41 billion. Long position liquidations accounted for $8.29 million of the $11.36 million in total 24-hour liquidations, highlighting persistent weakness among bullish traders.
Futures Market Shows Caution
Open Interest reached its zenith near $17 billion during Solana’s earlier rally this year. Following that peak’s unwinding, the metric has stabilized within a tighter range between approximately $4.5 billion and $6 billion. The current figure around $4.57 billion indicates traders maintain market presence but demonstrate reluctance to substantially increase leveraged exposure.
Spot market dynamics present a marginally more optimistic outlook. Throughout March, exchange inflows and outflows have achieved better equilibrium, with recent sessions displaying moderate net inflows. This pattern suggests early-stage accumulation behavior, though a definitive trend reversal has yet to confirm.
Technical Indicator Points to Potential Reversal
Cryptocurrency analyst Ali Charts shared on X that a TD Sequential buy indicator has emerged on the Solana price chart. “If it plays out, a move to the $77 resistance cluster could be next,” the analyst noted. This observation aligns with current technical analysis — a push above $67.50 could establish $75.63 as the next target, subsequently followed by the 50-day EMA around $80.25.
The Relative Strength Index currently reads approximately 26, firmly within oversold conditions. While this doesn’t guarantee an imminent reversal, it suggests the selling momentum may be approaching exhaustion.
On the resistance front, the zone near $68.94–$69.48 represents the critical area bulls must reclaim to catalyze a shift in market sentiment.
The post Solana (SOL) Price Slips Under $65 as Analyst Spots Buy Signal Targeting $77 appeared first on Blockonomi.


 English (US) ·