
 2 hours ago
14
2 hours ago
14

Tesla, Inc. stock closed at $365.54, marking one of its strongest technical setups in weeks. The roughly 4% rally pushed price through the upper Bollinger Band, driven by the Europe Semi launch and new Las Vegas robotaxi permits. The breakout is real, but it comes with structural caveats.
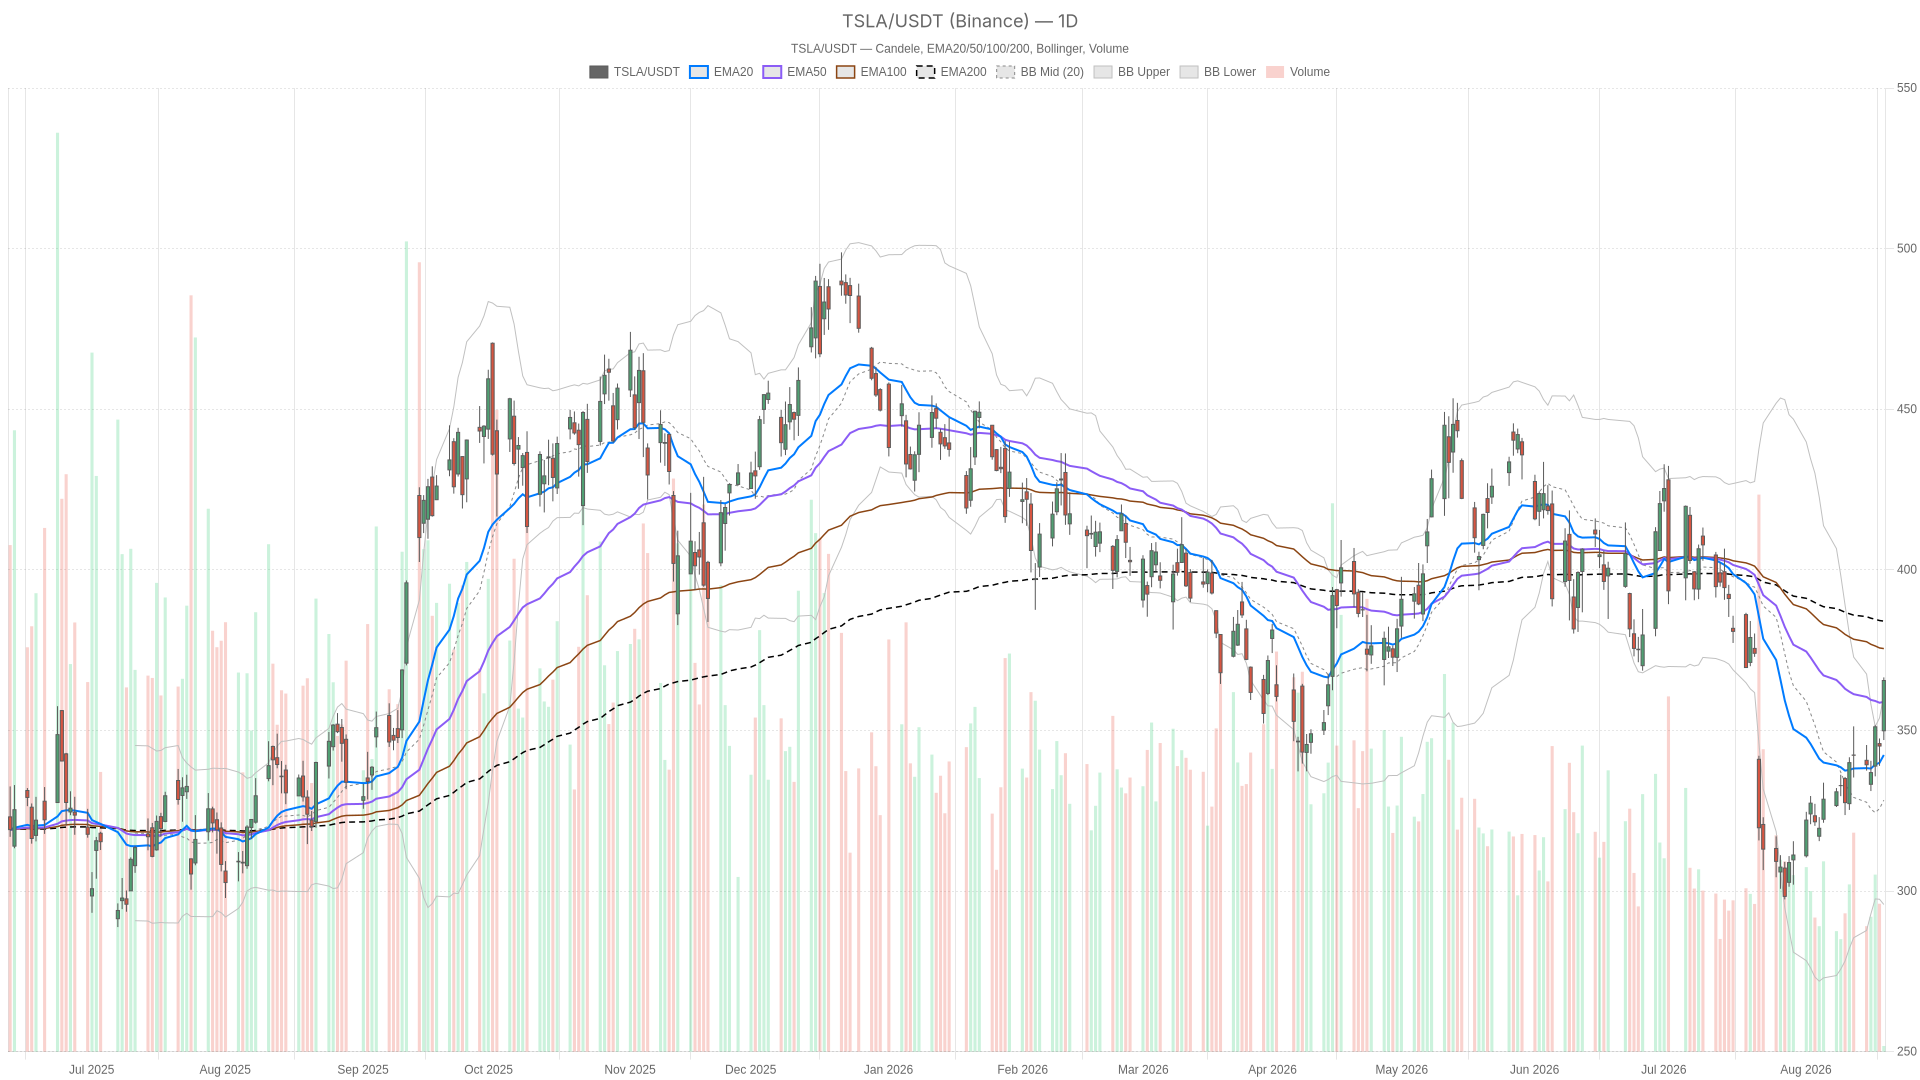 TSLA — daily chart with candlesticks, EMA20/EMA50 and volume.
Key takeaways
- Tesla, Inc. stock closed at $365.54, well above the daily pivot at $359.68.
- Price broke above the upper daily Bollinger Band at $360.75, signaling a volatility expansion event.
- The daily EMA200 at $384.02 remains overhead, keeping the broader trend technically bearish.
- Hourly RSI14 reached 74.57, entering overbought territory and warning of near-term consolidation risk.
- ATR14 at 11.51 on the daily chart confirms elevated volatility across all timeframes.
Daily Structure: A Breakout With a Caveat
Tesla, Inc. stock has broken out on the daily chart, yet the move remains structurally incomplete. Price now trades above the EMA20 and EMA50, but it still sits below the EMA200 at $384.02.
On the daily chart, price is trading above both the EMA20 at $342.35 and the EMA50 at $358.89. That is constructive. However, it remains below the EMA200 at $384.02. This single fact matters. It means the broader trend is still technically bearish. Short-term price action, meanwhile, has turned aggressively bullish. This is the core tension in the current setup.
RSI14 on the daily sits at 58.96, firmly neutral-to-bullish rather than overbought. That leaves room for further upside before the daily timeframe becomes stretched. The MACD tells a similar story. The line at -3.11 is above the -9.51 signal. The histogram has turned positive at 6.4, confirming that bearish momentum is fading and a bullish cross is building, even though the indicator has not fully flipped yet.
Meanwhile, the Bollinger Band picture stands out as the most dramatic piece of evidence. Price closed at $365.54, above the upper band at $360.75. The mid-band sits all the way down at $328.28. A close outside the band like this usually signals a volatility expansion event, not a routine session. ATR14 at 11.51 confirms daily ranges have widened meaningfully. Price now trades above the daily pivot point at $359.68 and is closing in on R1 at $372.36. S1 at $352.86 serves as the first line of defense if the rally stalls.
1H Timeframe: Confirmation, With an Overbought Warning
The hourly chart confirms the daily bullish tilt but warns of overbought conditions. Tesla, Inc. stock on the 1H timeframe shows a clean bullish EMA stack with RSI14 now at 74.57.
The hourly chart largely confirms the daily breakout narrative. EMA20 at $353.27, EMA50 at $344.99, and EMA200 at $344.85 are stacked in bullish order. Price is trading above all three. The regime tag on this timeframe reads bullish, aligning with the broader move. MACD is positive here as well. The line at 6.41 sits above the 4.69 signal, with a histogram of 1.71. This reinforces near-term upward pressure.
RSI14 on the 1H, however, is at 74.57. That is squarely overbought. Price is also sitting right on the hourly pivot point at $365.35. R1 lies just above at $366.69, with S1 at $364.19. In other words, the hourly chart has already done a lot of work. It is now pausing at a decision point rather than extending freely.
15-Minute Execution Context
The 15-minute chart shows a bullish EMA structure but with cooling momentum. Short-term RSI and MACD readings suggest a consolidation phase is more likely than an immediate extension higher.
On the 15-minute chart, the trend remains bullish by EMA structure. EMA20, EMA50, and EMA200 are all stacked upward. However, RSI14 at 70.73 is also overbought. The MACD histogram has slipped slightly negative at -0.47. This is a subtle but important detail. The MACD line at 3.36 is below the signal at 3.82, indicating cooling momentum.
In practice, this suggests short-term momentum is cooling right as price presses against the upper Bollinger Band at $365.98. The mid-band sits at $363.22. For traders using this timeframe for timing, that combination often precedes a brief consolidation or pullback. It does not point to an immediate extension higher.
Where the Timeframes Agree, and Where They Don’t
The daily and hourly timeframes agree on direction but differ on regime status. Tesla, Inc. stock is in a bullish momentum phase, yet the daily chart has not fully confirmed the shift.
Overall, the daily and hourly timeframes agree on direction. Tesla stock is in a bullish momentum phase. However, the daily regime is still tagged neutral. Price remains below the EMA200. Meanwhile, both the 1H and 15m regimes are tagged bullish. This is not a contradiction so much as a sequencing issue. The lower timeframes are already fully committed to the rally. The daily chart is still in the process of confirming it. At the same time, RSI readings on the 1H at 74.57 and 15m at 70.73 are both overbought. The daily RSI at 58.96 has plenty of room left. That divergence suggests the immediate move may be running ahead of itself, even as the bigger picture stays intact.
The Bullish Case for Tesla, Inc. Stock
The bullish case for Tesla, Inc. stock rests on both fundamental improvement and technical momentum. A sustained move above the daily EMA200 at $384.02 would confirm a genuine trend reversal.
The bullish scenario for Tesla stock is reinforced by fundamentals as well as price action. Tesla reported a 26% year-over-year revenue increase, according to recent coverage. This comes despite a 23% year-to-date decline in the stock itself. That gap between operating performance and share price has been part of the argument for renewed buying interest.
Notably, Ark Invest, led by Cathie Wood, reportedly held $1.16 billion of Tesla stock as of the end of the second quarter. The position has trailed other “Magnificent Seven” names this year. Still, the size of the holding reflects conviction in the long-term thesis. For the bullish case to build further technically, price needs to hold above the daily pivot at $359.68 and ideally clear R1 at $372.36.
A daily close that sustains above the upper Bollinger Band would add real weight to the breakout thesis. The MACD histogram would also need to continue expanding. Reclaiming the EMA200 at $384.02 would be the next major structural milestone. That would confirm the longer-term downtrend is genuinely over, rather than just interrupted.
The Bearish Case for Tesla, Inc. Stock
The bearish case for Tesla, Inc. stock hinges on the unresolved daily trend structure. Price remains below the EMA200, and overbought short-term indicators increase the risk of a failed breakout.
On the other hand, the bearish case rests on price still trading below the daily EMA200. If price fails to hold above the Bollinger upper band at $360.75 and slips back beneath the pivot point at $359.68, the breakout narrative weakens quickly. A drop through S1 at $352.86 would put the EMA50 at $358.89 and EMA20 at $342.35 in play again. That would suggest the recent rally was more news-driven than structural.
The overbought hourly and 15-minute RSI readings add near-term risk. A rejection at hourly R1 at $366.69, followed by a loss of the hourly EMA20 at $353.27, would be an early warning sign. Momentum would be fading faster than the daily chart implies. Notably, one analysis pointed out that Tesla shares tend to amplify broader market direction rather than move independently. A shift in overall market sentiment could therefore accelerate either scenario.
Positioning and Volatility Going Forward
Tesla, Inc. stock has produced a genuine daily breakout, backed by real catalysts and improving fundamentals. The near-term bias leans bullish, but the path higher is unlikely to be a straight line.
In summary, Tesla stock has produced a genuine breakout on the daily chart. Real catalysts and improving fundamentals back the move. Therefore, the near-term bias leans bullish. At the same time, overbought conditions on both the 1H and 15m timeframes persist. Price still sits below the daily EMA200. The path higher is unlikely to be a straight line.
ATR readings across all three timeframes point to elevated volatility. This cuts both ways for anyone tracking Tesla stock price action right now. Given the mix of strong momentum and stretched short-term indicators, the coming sessions should clarify the outlook. The question is whether this marks the start of a sustained trend shift or a sharp, news-driven spike that needs to consolidate before its next real test.
FAQ
Is Tesla, Inc. stock overbought right now?
On the hourly chart, RSI14 is at 74.57 and on the 15-minute chart at 70.73, both in overbought territory. However, the daily RSI14 at 58.96 remains neutral-to-bullish with room to run. This divergence suggests near-term consolidation risk within a still-intact broader setup.
What is the key level Tesla, Inc. stock needs to reclaim for a confirmed trend reversal?
The daily EMA200 at $384.02 is the critical level. Price currently trades below it, keeping the longer-term trend technically bearish. A sustained close above the EMA200 would confirm the downtrend is over rather than merely interrupted.
What catalysts drove the recent Tesla, Inc. stock rally?
The roughly 4% rally was driven by Tesla’s Europe Semi launch and new Las Vegas robotaxi permits. Notably, peers receiving the same regulatory approval barely moved, suggesting Tesla-specific momentum rather than a sector-wide catalyst.
What is the first support level if Tesla, Inc. stock pulls back?
The first line of defense is S1 at $352.86. Below that, the daily EMA50 at $358.89 and EMA20 at $342.35 come into play. A drop through these levels would suggest the breakout is failing and the rally was more news-driven than structural.
Disclaimer: This article is for informational purposes only and does not constitute financial advice, an investment recommendation, or a solicitation to buy or sell any financial instrument or cryptocurrency. The analysis provided is not indicative of future results. Investing in crypto assets and financial markets carries a high risk of capital loss. Always do your own research (DYOR) and consult a qualified financial advisor before making any decision.
Article produced with the assistance of artificial intelligence and reviewed by the editorial team.








 English (US) ·