
 3 hours ago
13
3 hours ago
13

Verizon Communications Inc. stock surged on July 24 after a Q2 earnings beat, raised guidance, record EBITDA, and a Google deal worth over $1 billion. Shares hit an intraday high of $45.45 before closing near $44.89. The fundamental story has improved. The technical structure still demands confirmation.
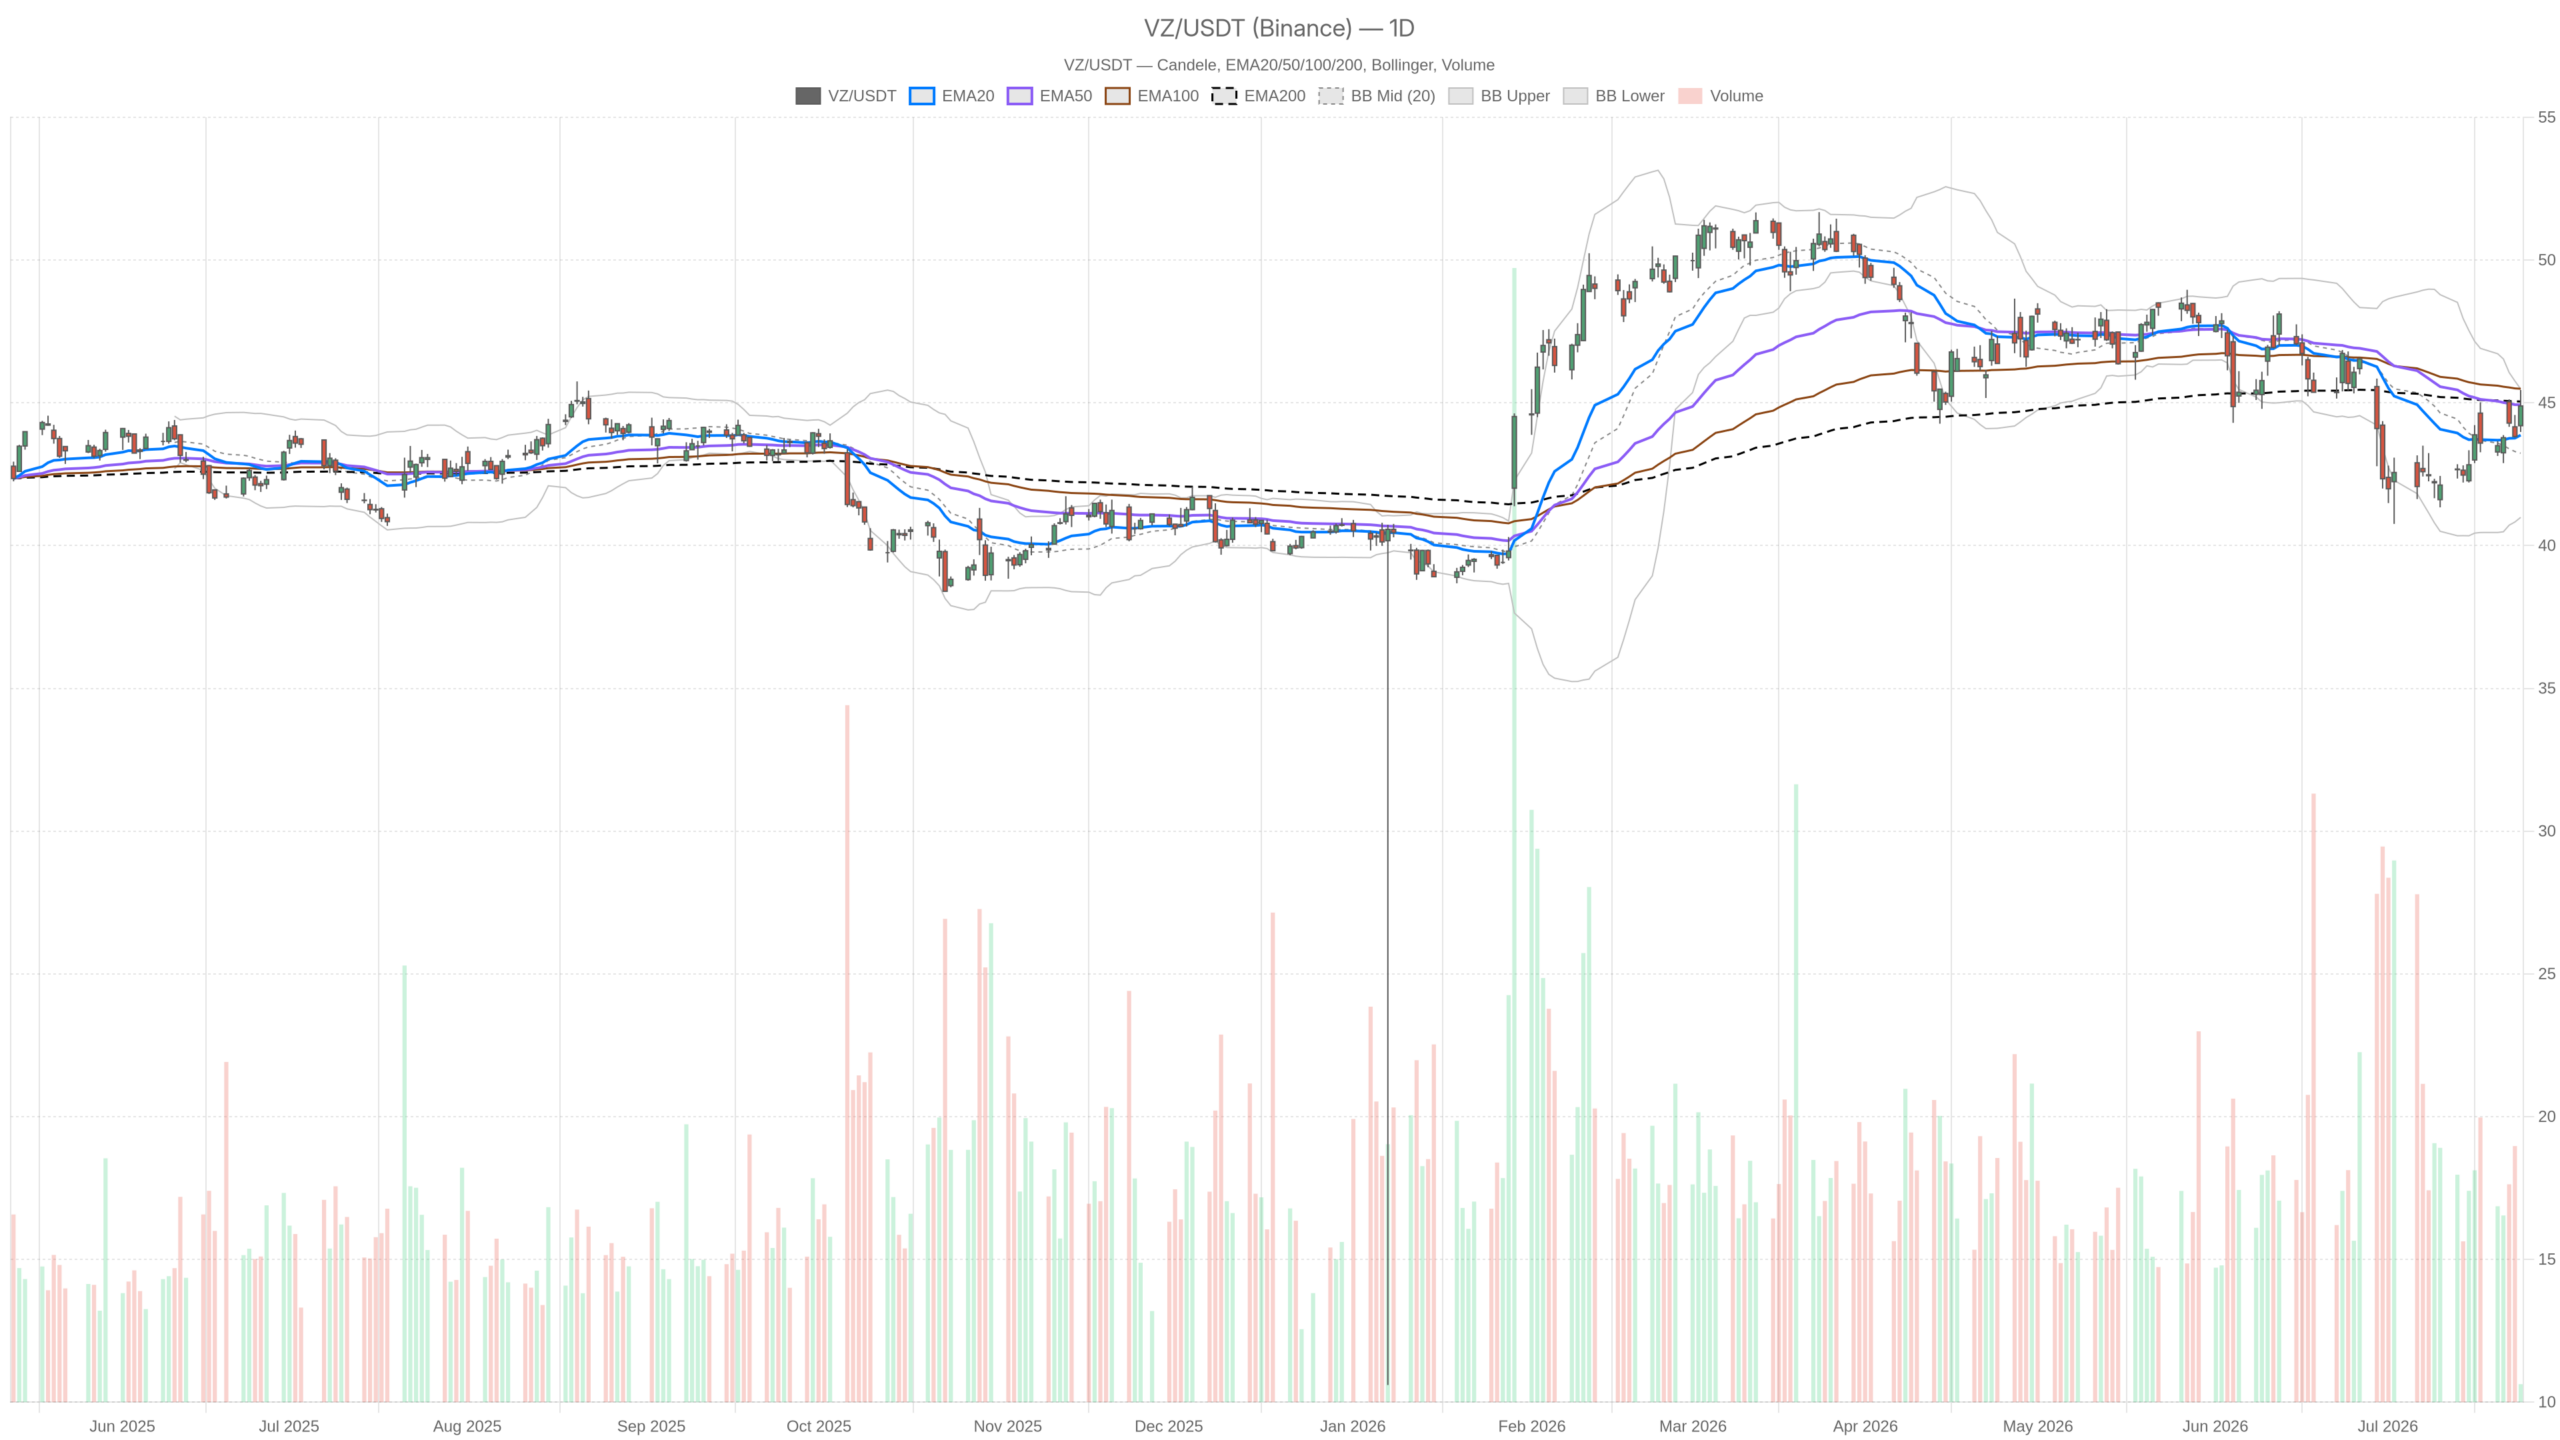 VZ — daily chart with candlesticks, EMA20/EMA50 and volume.
Key takeaways
- Verizon Communications Inc. stock closed at $44.89 after hitting an intraday high of $45.45 on July 24.
- Q2 earnings beat estimates by +2.36%, while revenue came in -3.00% below forecasts.
- The company added 184,000 postpaid phone net subscribers, well above analyst expectations.
- Record EBITDA, raised full-year 2026 guidance, and a mention of buybacks accompanied the results.
- A strategic Google deal worth over $1 billion adds long-term revenue visibility.
- The daily bias remains neutral, with price below both the EMA50 at $44.93 and EMA200 at $45.05.
Verizon Communications Inc. Stock Surges on Earnings Day
The session was one of the more consequential for Verizon Communications Inc. stock this year. A Q2 earnings beat landed alongside raised guidance, record EBITDA, and a freshly announced Google deal. Shares climbed, touching $45.45 intraday. They then pulled back to close around $44.89. The fundamental picture has clearly improved. The technical picture, however, is more complicated.
Daily Technical Structure
The daily timeframe sets the primary market regime as neutral. Price at $44.89 sits below both the EMA50 at $44.93 and the EMA200 at $45.05. The broader trend has not yet flipped constructive. However, the EMA20 at $43.87 is rising and acting as a dynamic floor. This staggered positioning signals recovery, not yet reversal.
Momentum Signals
The daily MACD reinforces this cautious read. Its line sits at -0.34 and the signal line at -0.69. The histogram remains positive at +0.35. This improvement is notable. Yet the lines remain in negative territory. Momentum is clearly rebuilding. It has not yet confirmed a bullish regime shift.
Meanwhile, the RSI14 at 55.27 sits comfortably neutral. It has room to run in either direction. This is a constructive setup if today’s catalysts drive follow-through buying.
Key Levels and Resistance
Bollinger Band positioning adds a useful layer. The upper band on the daily sits at $45.48. Today’s intraday high of $45.45 tested that level almost precisely. Price has not broken cleanly above the upper band. This suggests the move is approaching natural resistance. The pivot point of $44.77 has been cleared. R1 at $45.57 becomes the next meaningful overhead level.
Intraday Timeframes
On the 1H chart, the structure is considerably more bullish. The EMA20 at $44.09 and EMA50 at $43.75 both align below price. The EMA200 at $44.19 has already been reclaimed. This confirms genuine and sustained intraday momentum. However, the hourly RSI at 67.25 is approaching overbought territory. After a sharp earnings-driven move, this level often precedes consolidation. Chasing at current levels means buying into elevated short-term momentum.
The hourly MACD is nearly flat, with the line at 0.17 and signal at 0.18. This produces a marginally negative histogram of -0.01. Combined with RSI nearing resistance, any extension will require renewed buying pressure.
On the 15-minute chart, the regime is explicitly bullish. All three EMAs are stacked in proper order. The MACD histogram at +0.12 confirms active short-term momentum. The RSI at 62.27 leaves modest room for further upside. At the same time, pivot resistance at R1 sits at $45.04. The intraday high already tested $45.10. Price has bumped against the ceiling on the shortest timeframe. A sustained break above $45.10 would strengthen the near-term bullish case.
Fundamental Catalysts Driving the Move
The news flow is unambiguously positive for Verizon Communications Inc. stock. Q2 earnings delivered a +2.36% surprise. Revenue came in -3.00% below estimates. The market appears willing to overlook the miss given strength elsewhere. Subscriber growth was the real headline: 184,000 postpaid phone net additions, well above analyst forecasts. The company also posted record EBITDA. It raised full-year 2026 guidance alongside a mention of buybacks.
On top of the earnings story, the Google deal adds a strategic dimension beyond quarterly results. That kind of announcement signals confidence in future revenue visibility. Together, these catalysts explain today’s move. The more important question is whether they can sustain momentum through the $44.93–$45.57 resistance zone.
Bullish vs Bearish: Two Paths for Verizon Communications Inc. Stock
The constructive case for Verizon Communications Inc. stock is straightforward. A daily close above the EMA50 at $44.93 and EMA200 at $45.05 would shift the daily structure from neutral to early bullish. The upper Bollinger Band at $45.48 and pivot R1 at $45.57 form the next resistance zone. A clean break through that confluence — ideally on sustained volume — would validate the earnings-driven momentum. Supporting this scenario: the daily MACD histogram is improving, the RSI has room, and the fundamental catalysts are strong.
In contrast, the bearish case rests on a key technical reality. Price has not yet broken above its key moving averages on the daily chart. Today’s high at $45.45 tested but did not close above the daily Bollinger upper band. The hourly RSI near overbought territory and the flat hourly MACD both point to a market that has absorbed the initial excitement. Without follow-through, the stock could fade toward $44.10 — the daily S1 — or retest the EMA20 around $43.87.
The revenue miss also matters. If the broader market turns risk-off, the earnings beat alone may not sustain momentum above the $44.93–$45.05 EMA cluster. A daily close back below $44.77 would shift the short-term bias to cautious.
Volatility and Positioning Outlook
The daily ATR of $1.08 reflects a reasonably volatile session range for Verizon Communications Inc. stock. Today’s candle has already used most of that range. Entering new positions at current levels means accepting limited room before targets or stops are tested. The 15m ATR of $0.29 confirms contained intraday moves. Still, directional risk remains real at the daily level.
Overall, the setup is one of cautious optimism. The fundamental story has genuinely improved. Yet the technical structure demands confirmation before the daily bias can be called convincingly bullish. The $44.93–$45.57 zone is the battleground. How VZ closes the week relative to that range will define the next meaningful directional move.
FAQ
What drove Verizon Communications Inc. stock higher on July 24?
A Q2 earnings beat of +2.36%, raised full-year 2026 guidance, record EBITDA, 184,000 postpaid phone net additions, and a strategic Google deal worth over $1 billion all contributed to the rally.
What are the key resistance levels for VZ?
The critical resistance zone sits between $44.93 (EMA50) and $45.57 (pivot R1). The daily upper Bollinger Band at $45.48 also sits within this range. The intraday high of $45.45 tested this zone but failed to close above it.
Is the daily trend bullish or neutral for Verizon Communications Inc. stock?
The daily bias remains neutral. Price at $44.89 sits below both the EMA50 ($44.93) and EMA200 ($45.05). The MACD lines remain in negative territory. However, the rising EMA20 and improving histogram signal recovering momentum.
What would confirm a bullish reversal?
A daily close above both the EMA50 and EMA200 would shift the structure from neutral recovery to early bullish regime. A clean break above the $45.48–$45.57 resistance zone on sustained volume would further validate the move.
Disclaimer: This article is for informational purposes only and does not constitute financial advice, an investment recommendation, or a solicitation to buy or sell any financial instrument or cryptocurrency. The analysis provided is not indicative of future results. Investing in crypto assets and financial markets carries a high risk of capital loss. Always do your own research (DYOR) and consult a qualified financial advisor before making any decision.
Article produced with the assistance of artificial intelligence and reviewed by the editorial team.








 English (US) ·