
 2 months ago
50
2 months ago
50
Disney Stock trades at $96.01 with a bearish regime across all timeframes. Price sits below every major moving average, momentum is deteriorating, and the stock struggles to reclaim pivot resistance. A bold Wells Fargo thesis offers a longer-term catalyst, but does not alter the near-term structure.
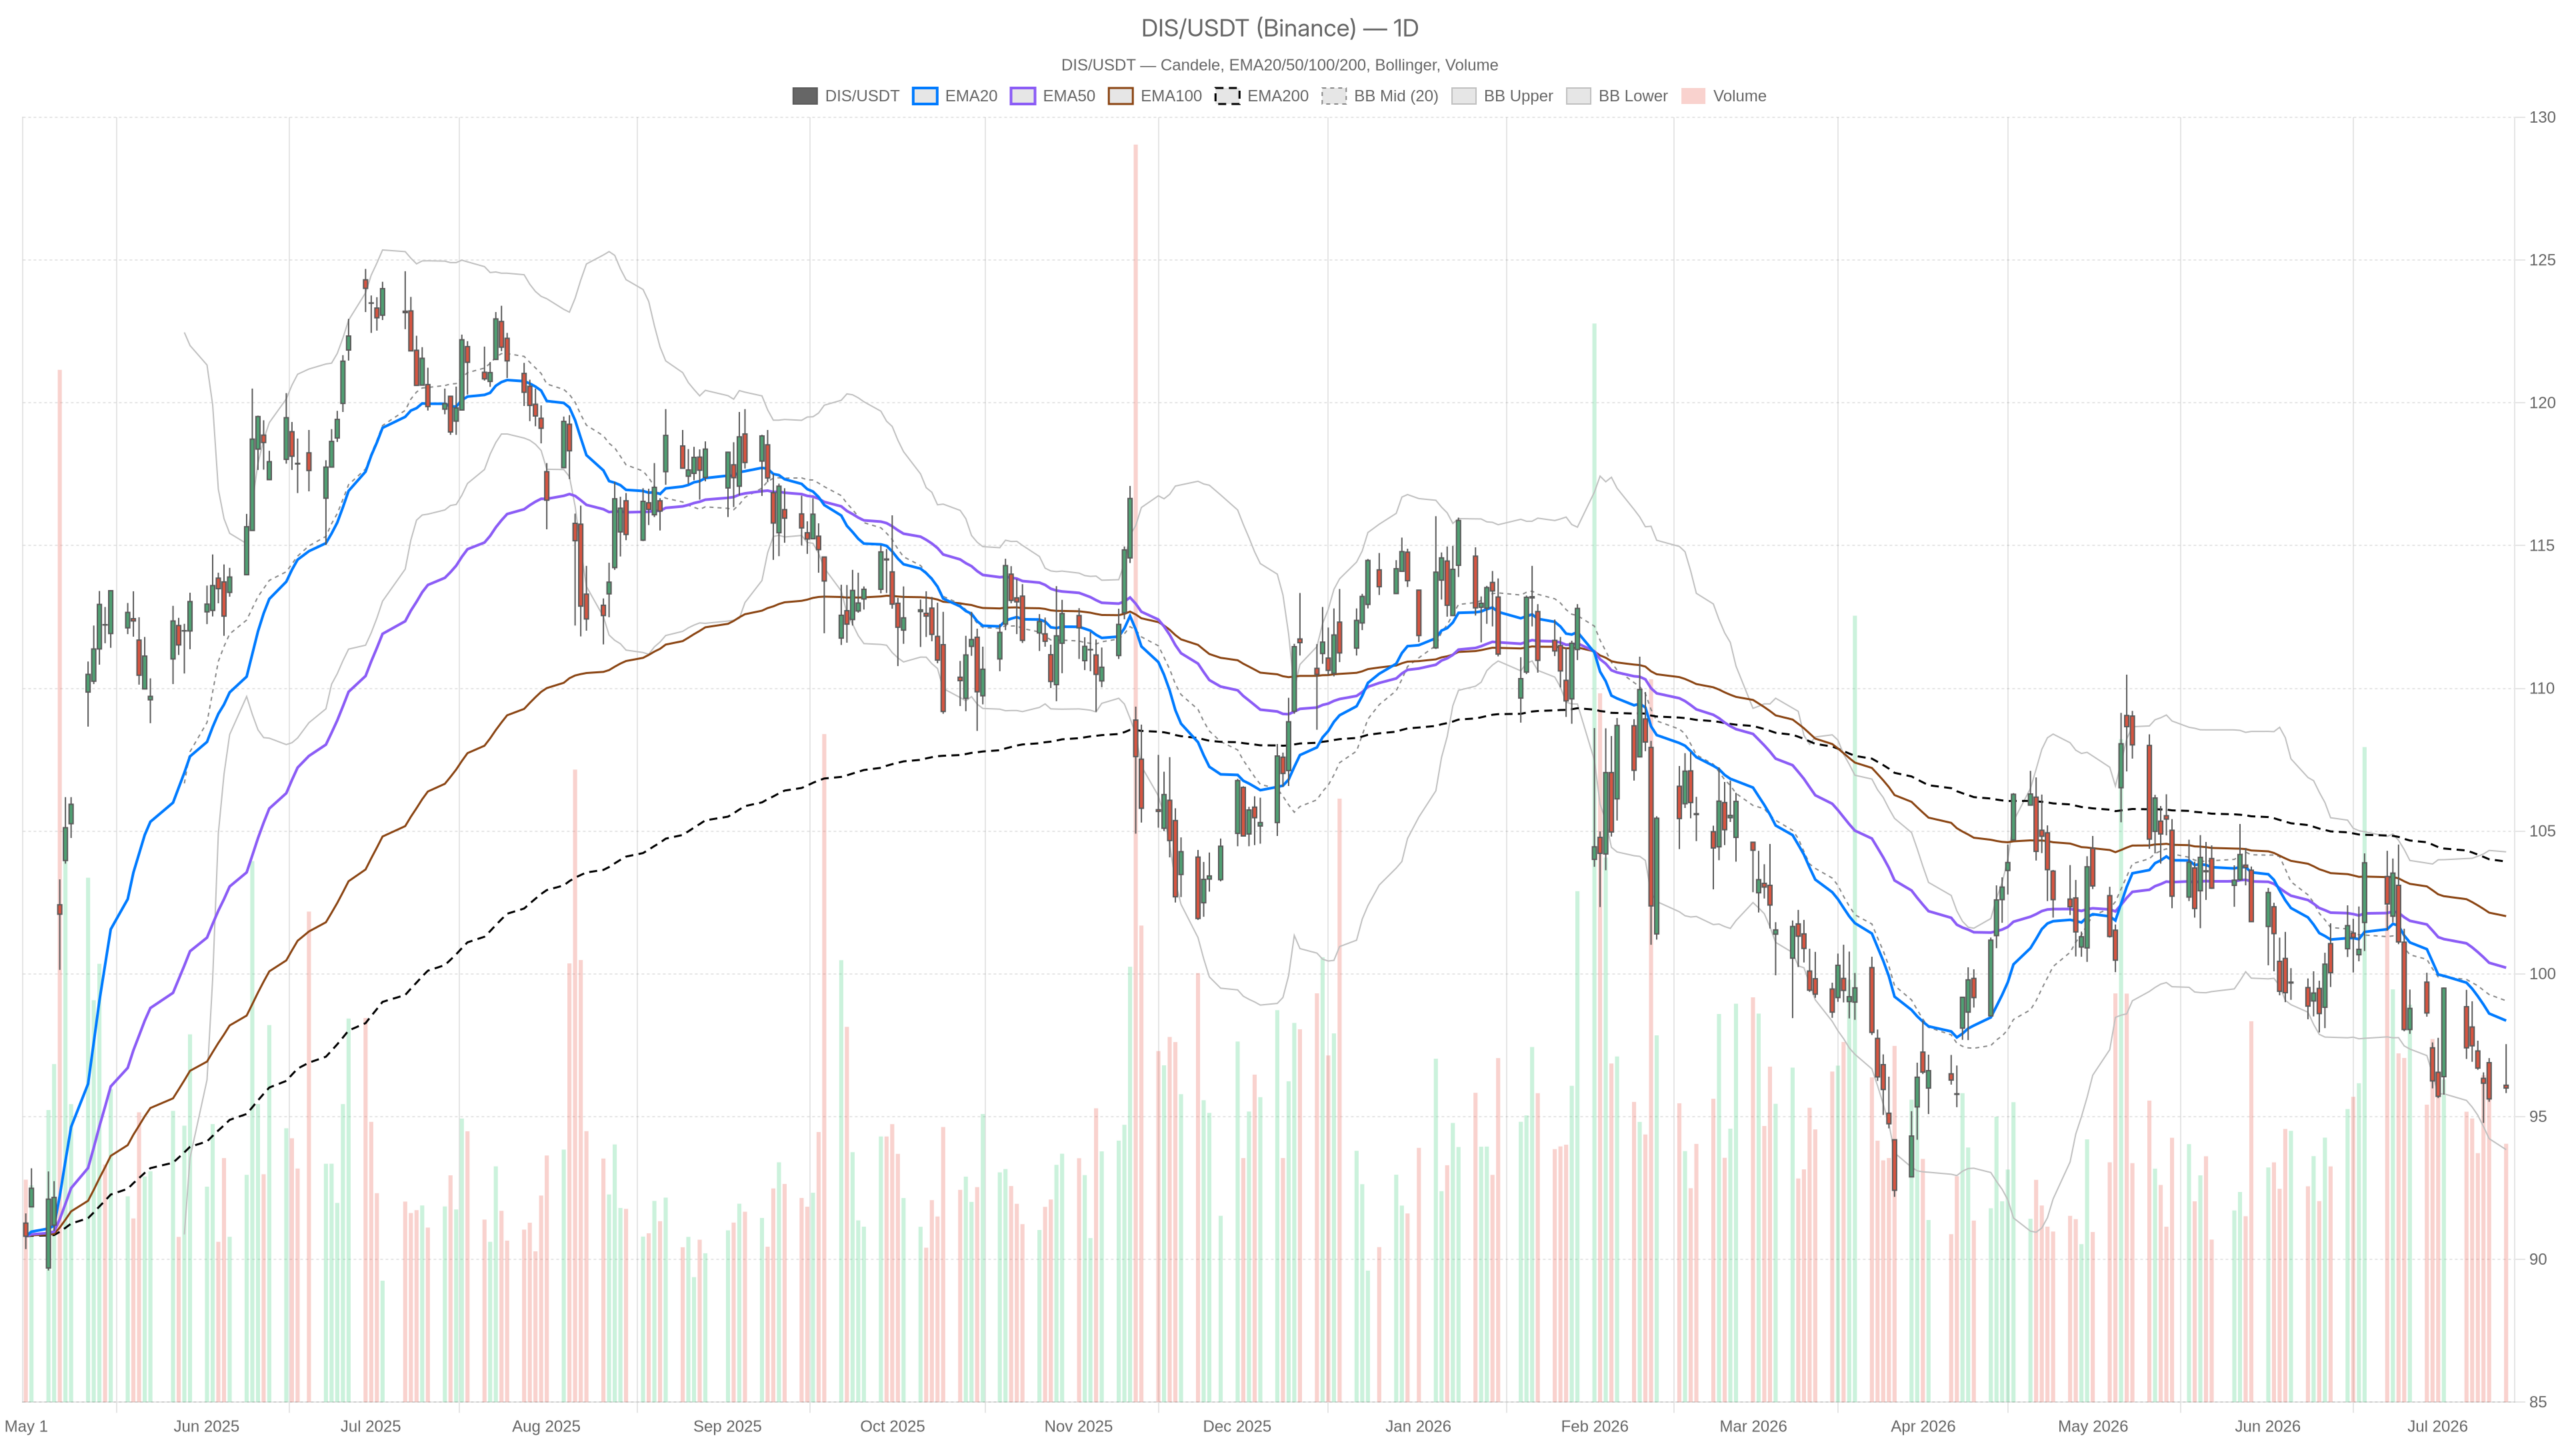 DIS — daily chart with candlesticks, EMA20/EMA50 and volume.
Key takeaways
- DIS closed at $96.00 on the daily chart, below the 20-day EMA at $98.36, 50-day at $100.22, and 200-day at $103.93
- Daily RSI at 40.34 confirms bearish momentum without reaching oversold territory
- Wells Fargo analyst Steven Cahall outlined a 40% upside scenario contingent on Disney exiting streaming entirely
- The daily Bollinger lower band at $93.84 is the nearest structural downside target
- A bullish recovery requires reclaiming the EMA20 at $98.36 with conviction
Disney Stock: A Bearish Daily Structure That Demands Respect
The daily chart is unambiguously bearish for Disney stock. Price sits below all three key moving averages — a configuration that reflects months of sustained selling pressure.
DIS closed at $96.00 after trading between $95.83 and $97.54. That range alone signals indecision without upside conviction. Notably, the 20-day EMA sits at $98.36, the 50-day at $100.22, and the 200-day at $103.93. Disney stock trades below all three.
Momentum Indicators Leave No Room for Bulls
The daily RSI at 40.34 confirms the bearish picture. The reading is not yet in oversold territory, so there is no technical bounce signal from exhaustion. Instead, it reflects a market drifting lower without urgency. Meanwhile, the daily MACD reinforces the bear case. The line sits at -1.47, below the signal at -1.21. The histogram remains negative at -0.26.
Bollinger Bands place the midline at $99.06 and the lower band at $93.84. Price trades in the lower half of the range. That confirms sellers remain in control. The ATR of 2.28 suggests moderate daily volatility. Moves of $2–$3 are normal and should not be mistaken for trend reversals.
Hourly Chart: No Meaningful Pushback Against the Daily Trend
The 1-hour chart does nothing to challenge the daily bearish bias. Disney stock remains trapped below its intraday moving averages, with only a marginal MACD histogram flicker hinting at stabilization.
DIS is positioned below its 1H EMA20 at $96.30, EMA50 at $96.88, and EMA200 at $99.37. The bearish regime is intact at the intraday level. However, the 1H MACD histogram has turned marginally positive at +0.04. The line sits at -0.19, slightly below the signal at -0.23.
In isolation, that histogram flip could suggest minor short-term stabilization. In context, however, it carries little weight. The RSI on the 1-hour chart reads 45.01 — neutral to weak — and provides no evidence of genuine buying pressure. The 1H Bollinger Bands show a tight range between $95.33 and $96.94, with price hugging the midline at $96.14. This is consolidation, not accumulation.
The 1H pivot sits at $95.99, with R1 at $96.15 and S1 at $95.85. Price straddles the pivot point, unable to push meaningfully above R1. Consequently, the market lacks the momentum to break higher even on a short-term basis.
15-Minute Context: Flat, Compressed, and Seller-Favored
The 15-minute chart mirrors the weakness seen on higher timeframes. Disney stock cannot find its footing above the key moving averages, even on the shortest timeframe.
Price closed at $96.01 with a high of $96.12 — barely below R1 at $96.15. The 15m MACD histogram is slightly negative at -0.06, with both the line and signal in negative territory. At the same time, the RSI at 42.28 mirrors the weakness seen on higher timeframes. No intraday setup suggests an imminent recovery.
The 15m EMA structure — 20 at $96.28, 50 at $96.36, 200 at $96.91 — shows all three averages above price. Overall, for short-term traders, this points toward continued distribution near current levels.
The Wells Fargo Thesis: Real Catalyst or Distant Hope?
The Wells Fargo thesis offers a potential long-term rerating catalyst for Disney stock, but it carries no near-term technical weight.
The news cycle on July 13 was dominated by a striking call from Wells Fargo analyst Steven Cahall. The thesis: Disney could rally 40% if it exits the streaming business entirely and refocuses on content creation and IP. The argument centers on the idea that Disney’s online distribution unit is increasingly uncompetitive. Meanwhile, its content and intellectual property grow more valuable over time. DIS stock gained nearly 2% on the back of that note.
On the same day, a separate analyst initiated coverage with a Buy rating, pointing to parks and streaming as growth drivers. That view directly contradicts the Wells Fargo angle. The divergence in analyst opinion introduces fundamental uncertainty on top of an already weak technical structure.
Wells Fargo’s 40% upside scenario is conditional on a major strategic pivot. That is not a near-term price driver. In short, it is a rerating thesis requiring months of corporate decision-making and execution. In the meantime, the chart reflects a stock that has not yet found a floor.
Bullish Scenario: What Would Need to Change
A genuine bullish recovery in Disney stock requires reclaiming the EMA20 at $98.36 with conviction. That level aligns with the Bollinger midline at $99.06 and would mark the first real sign that buyers are stepping in.
Above that, the EMA50 at $100.22 is the key structural target. A move back above $100 would shift the intermediate-term narrative meaningfully. However, for that to happen, the daily RSI would need to push above 50. The MACD would also need to turn positive on the daily timeframe. Neither is imminent given current readings.
Still, if the Wells Fargo strategic thesis gains traction and management signals a shift, that could accelerate a technical recovery. Without a fundamental catalyst of that magnitude, the technical case for bulls remains weak.
Bearish Scenario: The Path of Least Resistance
On the downside, the daily Bollinger lower band at $93.84 stands as the nearest structural target for Disney stock if selling accelerates.
The daily S1 pivot at $95.37 is the first line of defense for bulls. A daily close below that level would confirm continued deterioration. Given that price is already in the lower half of the Bollinger range, and RSI has not reached oversold levels, there is room to fall further before technical capitulation sets in.
The absence of any meaningful volume surge or RSI divergence on the daily chart suggests sellers are not exhausted. Therefore, the bearish case remains the path of least resistance unless a clear catalyst shifts the structure.
Positioning, Volatility, and the Uncertainty Ahead
Overall, Disney stock presents a technically bearish setup with a speculative fundamental wildcard. The Wells Fargo note introduced short-term noise — a 2% intraday bounce — but has not altered the underlying price structure.
All three timeframes remain in bearish regimes. Price is compressed below its key moving averages, and momentum indicators offer no reversal signal. At the same time, the ATR of 2.28 on the daily timeframe reflects moderate but manageable volatility. That environment is not favorable for impulsive positioning.
Traders should respect the dominant trend while monitoring whether the $95.37 daily support holds or breaks. Any sustained recovery attempt will face significant overhead resistance beginning at $98.36. Until that level is reclaimed, the burden of proof rests squarely with the bulls.
FAQ
Is Disney Stock in a bearish or bullish trend?
Disney stock is in a bearish trend across all three timeframes — daily, 1-hour, and 15-minute. Price sits below every major moving average, the daily RSI reads 40.34, and the MACD remains negative.
What price level does Disney Stock need to reclaim to turn bullish?
Disney stock needs to reclaim the EMA20 at $98.36 with conviction. Above that, the EMA50 at $100.22 is the key structural target for shifting the intermediate-term narrative.
What is the Wells Fargo analyst’s thesis on Disney Stock?
Wells Fargo analyst Steven Cahall argues Disney stock could rally 40% if the company exits the streaming business entirely and refocuses on content creation and intellectual property.
What is the nearest support level for Disney Stock?
The nearest support is the daily S1 pivot at $95.37. Below that, the daily Bollinger lower band at $93.84 is the next structural downside target.
Disclaimer: This article is for informational purposes only and does not constitute financial advice, an investment recommendation, or a solicitation to buy or sell any financial instrument or cryptocurrency. The analysis provided is not indicative of future results. Investing in crypto assets and financial markets carries a high risk of capital loss. Always do your own research (DYOR) and consult a qualified financial advisor before making any decision.
Article produced with the assistance of artificial intelligence and reviewed by the editorial team.






 English (US) ·