
 6 hours ago
12
6 hours ago
12
TLDR
- XRP defended critical $1.10 support on June 11, trading around $1.12 following increased late-day trading volume
- Technical Elliott Wave analysis identifies a three-wave impulse structure targeting $2.39 to $3.11
- Crypto analyst Ali Charts identified a TD Sequential buy signal appearing on the 3-day chart, suggesting potential short-term bounce
- XRP exchange-traded funds attracted $1.19 million in net inflows, pushing total assets toward $948.98 million
- Immediate resistance zone established at $1.12–$1.13, with $1.2380 middle Bollinger Band representing next significant hurdle
XRP maintained its position above the $1.10 threshold throughout June 11 trading, settling near $1.12 with approximately $1.94 billion in 24-hour trading volume. The digital asset posted a modest 0.72% daily gain while recording a 4.47% weekly decline and a 23.86% monthly drop. Market capitalization stood at approximately $69.2 billion, securing the sixth position among all cryptocurrencies.
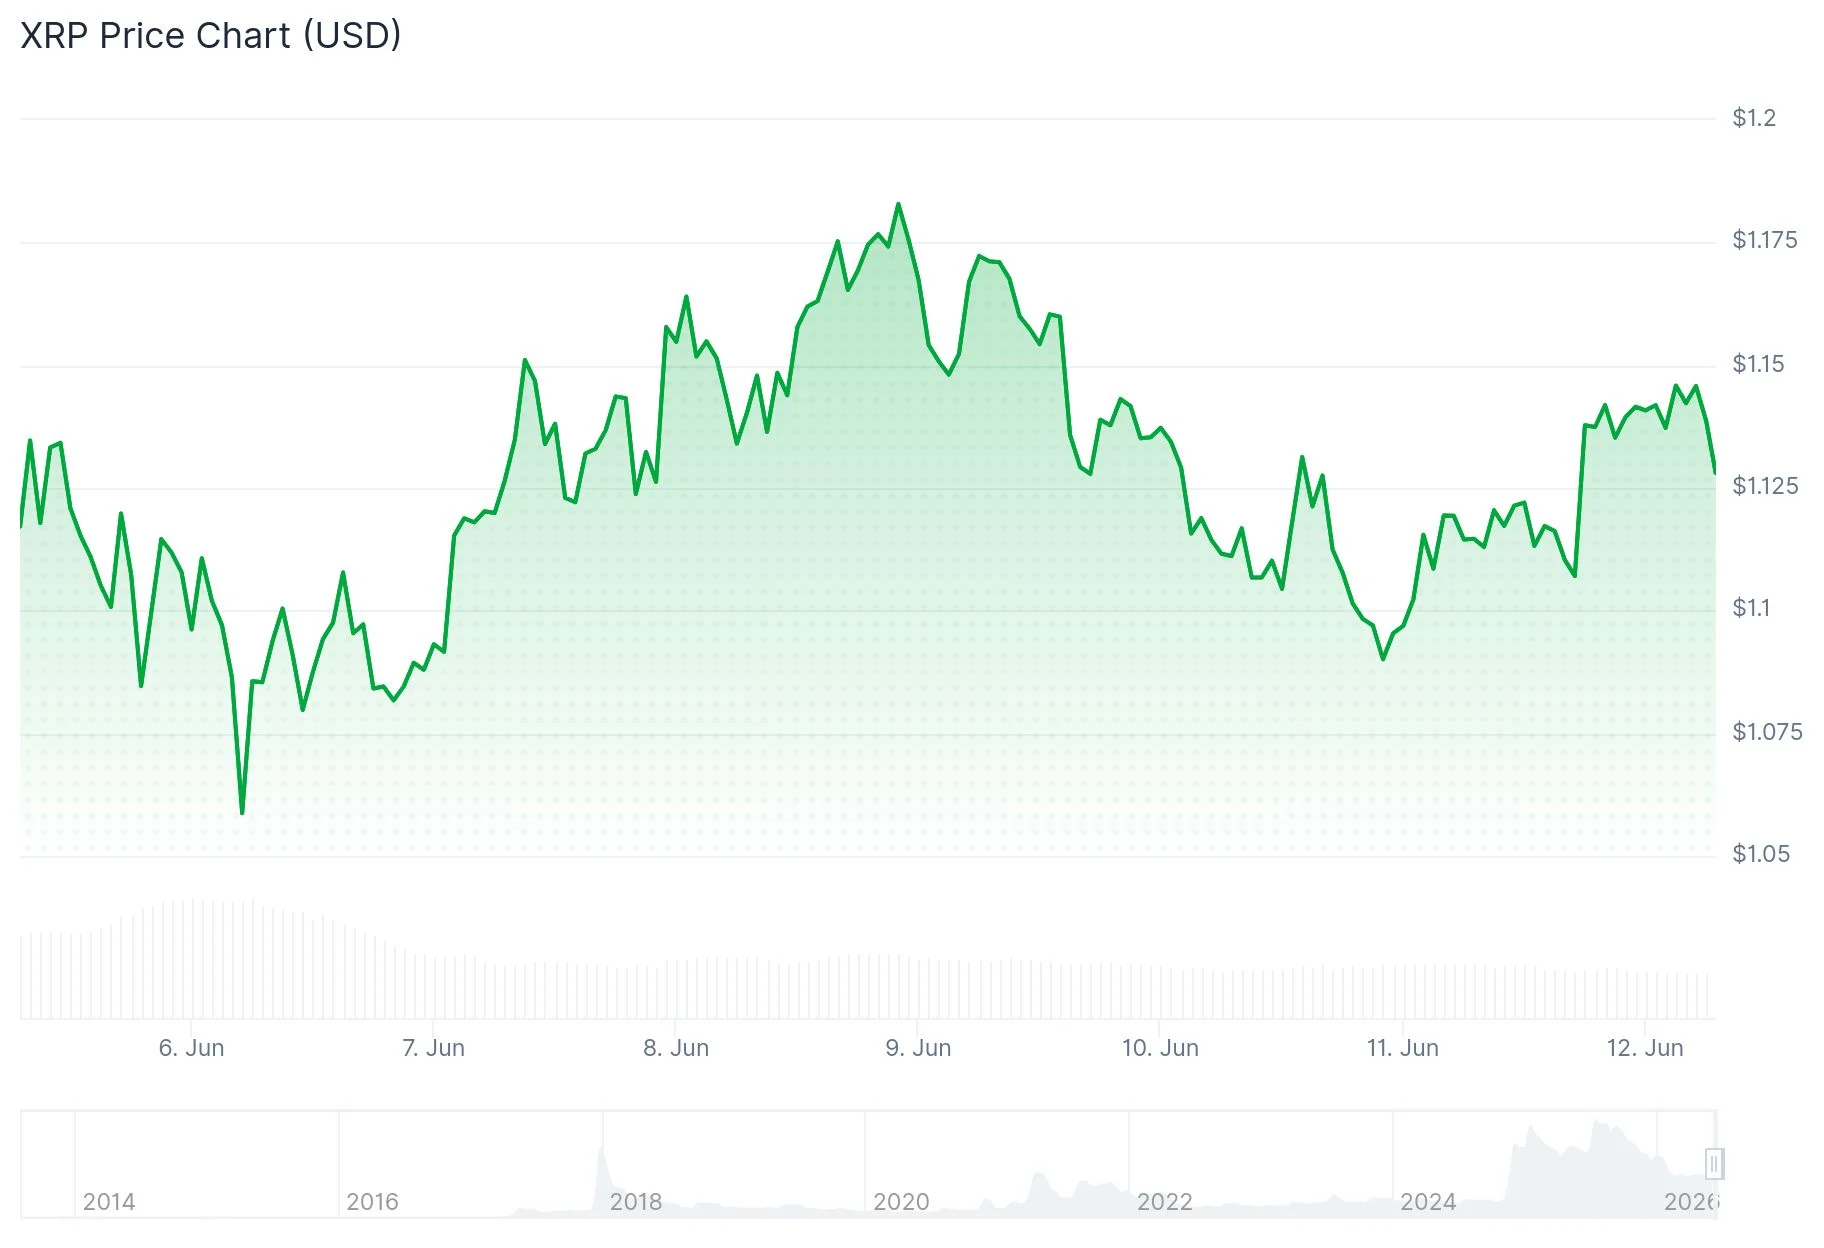 XRP Price
Market activity demonstrates that buyers successfully protected the $1.10 region after last week’s substantial selloff. This price level has emerged as critical near-term support, positioned close to the most recent breakdown point.
Crypto analyst Ali Charts highlighted on X that the TD Sequential indicator has generated a buy signal on XRP’s 3-day timeframe. The analyst notes that such high-timeframe signals have previously resulted in rebounds lasting one to four candlesticks, potentially providing short-term upside momentum following recent consolidation.
XRP temporarily climbed above $1.12 during evening hours on elevated volume. Earlier trading saw the asset hovering near $1.11, where accumulation appeared to develop.
The $1.12–$1.13 range represents the initial resistance barrier market participants are monitoring. A sustained close beyond $1.13 accompanied by volume expansion could establish a path toward $1.18 and subsequently $1.2380. Should XRP fall beneath $1.10, downside targets include $1.09 and the lower Bollinger Band positioned around $1.04.
Elliott Wave Structure Suggests $2.39–$3.11 Upside Potential
A technical analysis chart posted on X by analyst RWA_Investor outlines a potential three-wave Elliott correction pattern developing from the recent $1.07 bottom. This technical framework projects Wave A extending to approximately $1.94, followed by a Wave B correction toward $1.46, before Wave C completes in the $2.39 to $3.11 range.
I’m now expecting a three-part Impulse
very impulsive. #XRP
Side-line capital is getting f***ed
If we break past 3.10, the bottom has already been reached; if not, then this is an upward correction and we will retest the $0.75–$1 range later to finish Macro Wave 2  pic.twitter.com/OagpreIul9
— RWA_Investor (@RWA_Investor) June 7, 2026
The Wave B retracement to $1.46 should not be interpreted as bearish momentum, according to this technical framework. Instead, it represents a typical corrective pattern before the most powerful impulse wave materializes.
A confirmed breakout and close above $3.10 would indicate that XRP has established a macro bottom in the $1.05 region. If the recovery fails to reach the upper projection band, analysts have outlined an alternative bearish scenario involving a potential retest of the $0.75–$1.00 support zone.
Investment Product Flows Increase Amid Sideways Price Action
XRP-focused investment vehicles attracted $1.19 million in daily net inflows based on SoSoValue tracking data, bringing total net assets to approximately $948.98 million. While inflows represent a constructive development, total assets remain beneath previous peak levels.
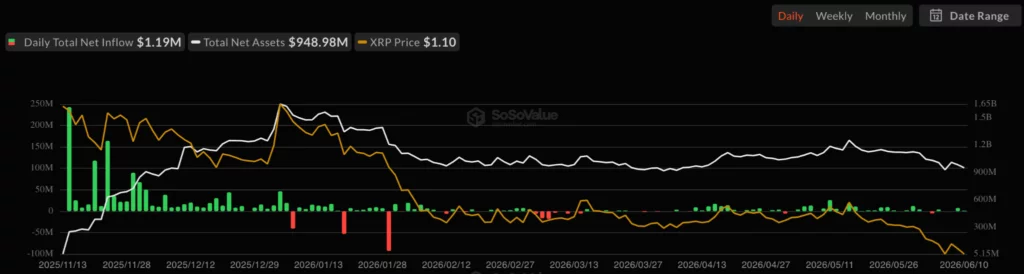 Source: SoSoValue
Open interest metrics hover near cycle lows, indicating that market participants have not yet established substantial directional bets. Trading volume shows signs of improvement, though current market behavior suggests participants are engaging in short-duration trades rather than establishing longer-term positions.
The daily chart structure maintains a downtrend originating from January peaks above $2.30. XRP experienced sideways consolidation between March and May before experiencing downside continuation in June. Bulls must recapture the middle Bollinger Band at $1.2380 to signal that a sustainable recovery pattern is taking shape.
The post XRP Bulls Eye $3.11 Target After TD Sequential Triggers on 3-Day Timeframe appeared first on Blockonomi.


 English (US) ·