
 2 months ago
48
2 months ago
48
- Ethereum continues struggling beneath the key $2.3K-$2.4K resistance zone as bearish momentum builds.
- ETH recently broke below an ascending wedge pattern, signaling growing downside risk on lower timeframes.
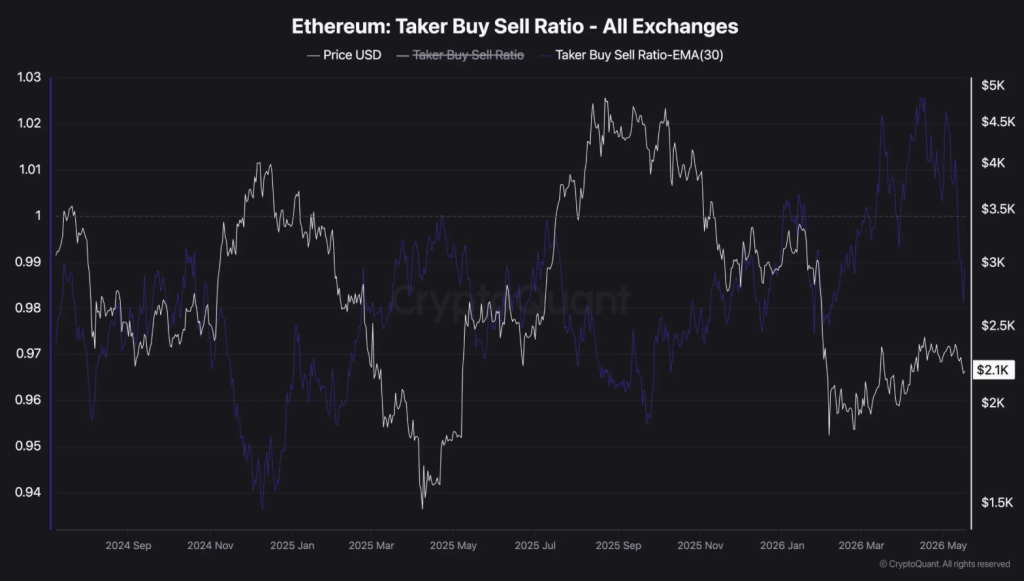
- Futures market sentiment remains weak, with the Taker Buy Sell Ratio staying below the neutral level of 1.
Ethereum’s latest recovery attempt appears to be losing steam after repeated failures beneath the important $2.3K-$2.4K resistance area. What initially looked like a decent rebound has slowly turned weaker over recent sessions, with sellers continuing to defend higher levels aggressively whenever ETH tries to push upward. The market structure is starting to lean more bearish now, especially as buyers struggle to maintain momentum above nearby support zones.
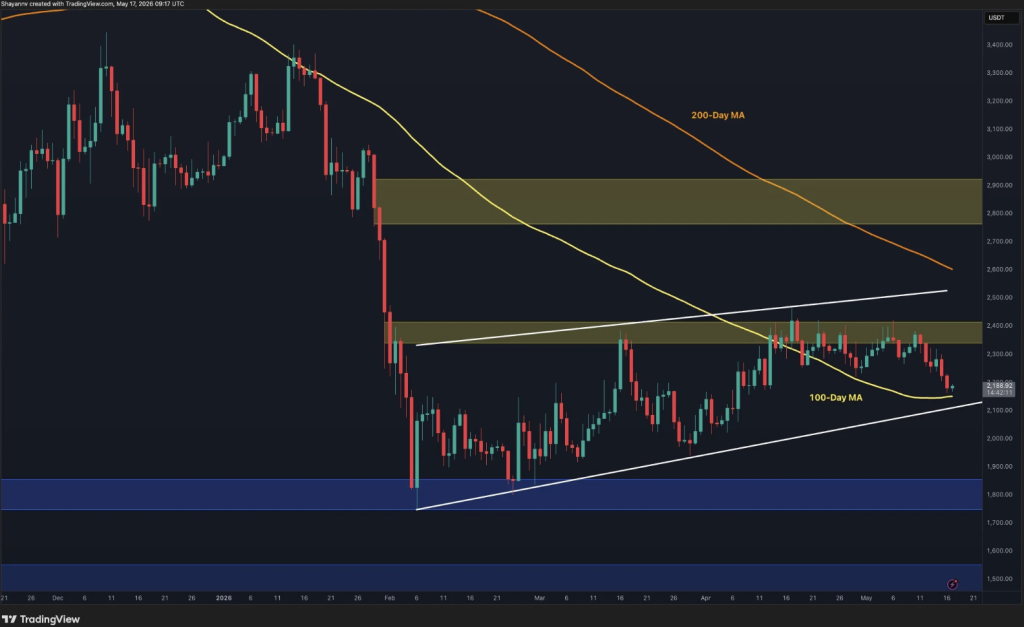
On the daily timeframe, Ethereum faced another sharp rejection from the broader resistance cluster sitting just below $2.4K. This region has become a major supply zone over the past several weeks, repeatedly blocking bullish continuation and forcing price back lower. Every failed breakout attempt tends to weaken confidence a little more, and traders are clearly starting to notice that pattern developing. Momentum simply hasn’t been strong enough to fully flip the structure bullish again.
ETH Approaches Critical Support Levels
The latest pullback has pushed ETH closer toward its 100-day moving average, which now acts as the next major dynamic support level. If Ethereum breaks cleanly beneath that moving average, analysts believe another bearish leg could quickly develop toward the broader $1.8K-$1.85K demand zone. That area remains extremely important because it previously attracted strong buying interest during earlier declines.
At the same time, the broader chart structure still resembles a corrective trend underneath the descending 200-day moving average near the $2.6K region. That longer-term setup suggests Ethereum hasn’t fully escaped its fragile market structure despite earlier rebound attempts. Unless buyers manage to reclaim the $2.4K resistance zone and stabilize above it, downside continuation currently looks like the more likely path, honestly.
Lower Timeframes Flash Clear Bearish Signals
On the 4-hour chart, Ethereum recently confirmed one of the clearest bearish signals traders have seen in weeks after breaking below the lower boundary of its ascending wedge pattern. Once the breakdown happened, selling pressure accelerated quickly and dragged ETH into the first major demand zone between roughly $2.18K and $2.22K. That support region has now become the key short-term battleground.
If buyers successfully defend the current zone, Ethereum could enter a temporary consolidation phase or even stage a short-term rebound back toward the broken wedge boundary near $2.3K. But if the $2.2K area fails to hold, the next downside target likely sits around the broader $2.05K-$2.1K demand region. The recent breakdown also invalidated much of the earlier bullish recovery structure, which is important because it signals sellers have regained short-term control over momentum.
Unless ETH quickly recovers above the broken trendline and climbs back over $2.3K, bearish pressure may continue dominating in the coming sessions. Right now, buyers still look reactive instead of fully confident.
Futures Market Sentiment Remains Weak
Market sentiment inside Ethereum’s derivatives market also continues leaning bearish. The Taker Buy Sell Ratio, a metric used to measure aggressive buying versus aggressive selling activity in Futures markets, has remained consistently below the neutral level of 1. Recent readings near 0.96 to 0.97 suggest sellers are still dominating market orders while bullish conviction remains relatively weak.
Although there have been small rebounds in the ratio recently, buyers have repeatedly failed to regain sustained control. That ongoing imbalance lines up closely with Ethereum’s recent price weakness and the bearish breakdown seen across lower timeframes. In simple terms, aggressive demand still looks limited while selling pressure continues building underneath resistance.
If the Taker Buy Sell Ratio stays below 1 while ETH remains trapped beneath the $2.3K-$2.4K resistance zone, analysts believe the bearish setup could strengthen even further. Under those conditions, Ethereum may eventually revisit lower support regions around $2.1K and possibly even the broader $1.8K area if market weakness accelerates.
Disclaimer: BlockNews provides independent reporting on crypto, blockchain, and digital finance. All content is for informational purposes only and does not constitute financial advice. Readers should do their own research before making investment decisions. Some articles may use AI tools to assist in drafting, but every piece is reviewed and edited by our editorial team of experienced crypto writers and analysts before publication.


 English (US) ·