
 3 hours ago
10
3 hours ago
10
As of June 19, 2026, the broader crypto market is bleeding roughly 2.4% in 24 hours while Bitcoin dominance sits above 55.9%. The Ripple price reflects this bearish environment, with XRP trading at $1.13 USDT and grinding lower with little conviction from either side.
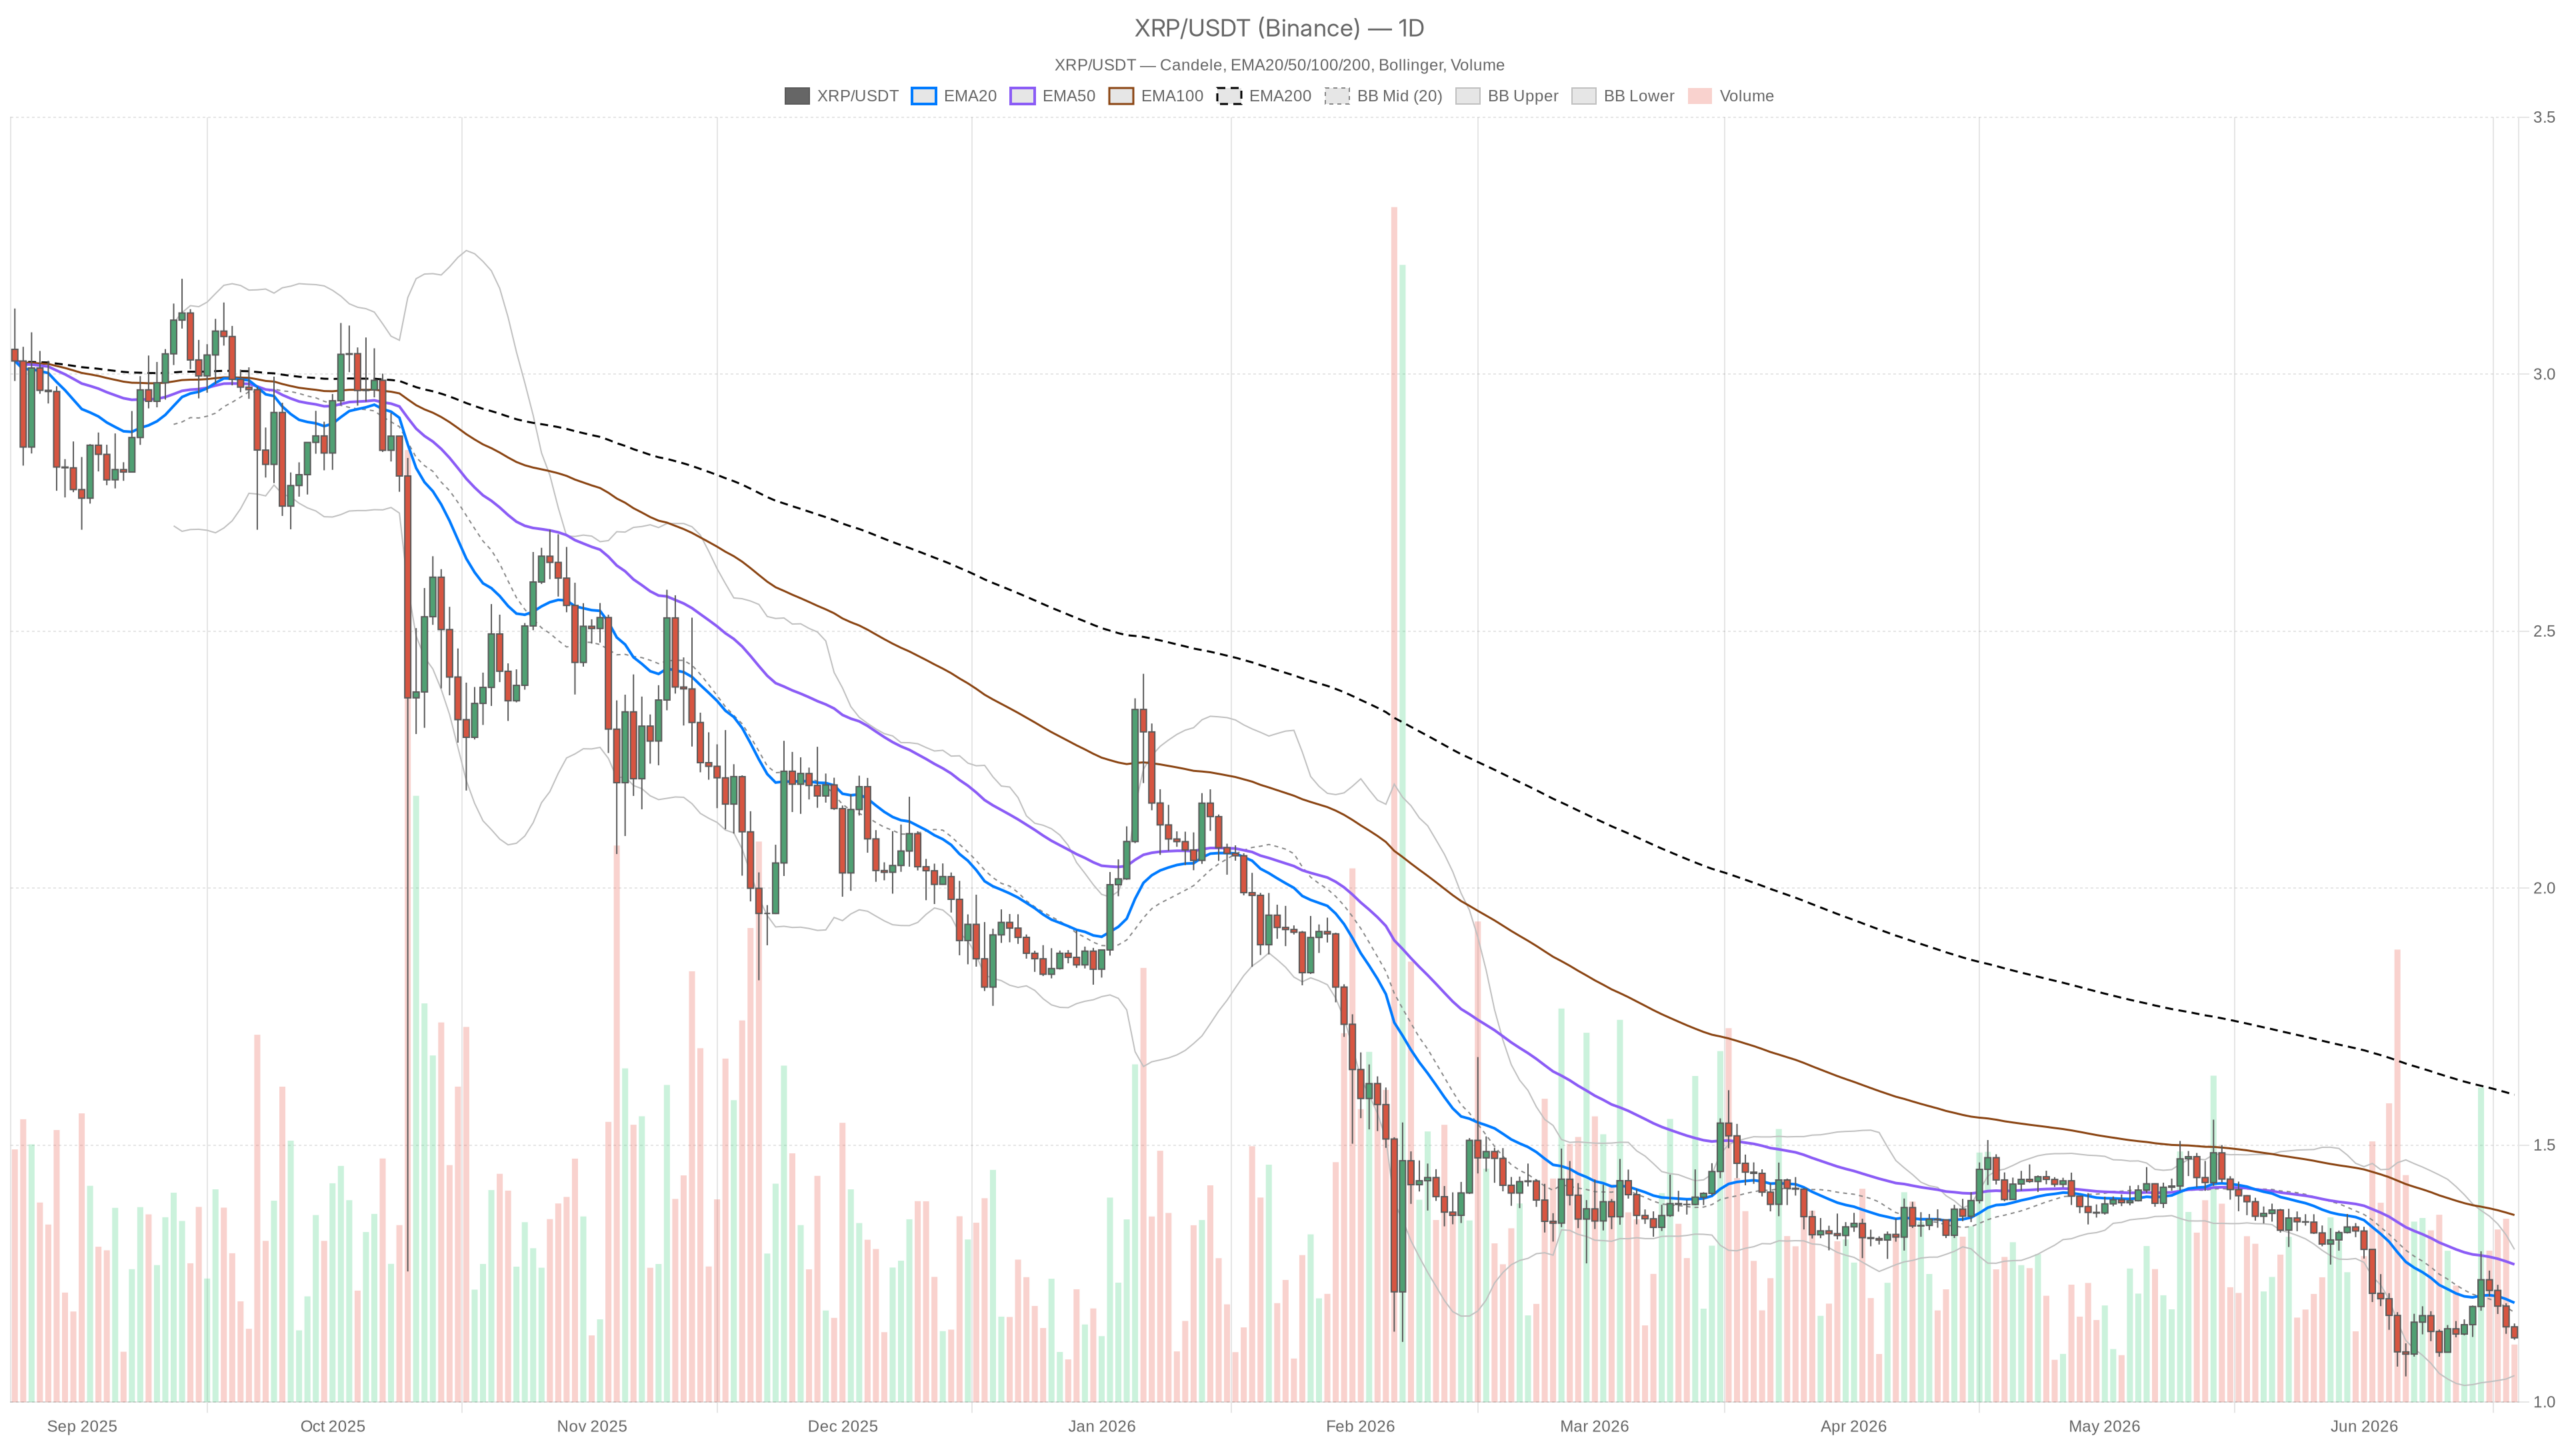 XRP/USDT — daily chart with candlesticks, EMA20/EMA50 and volume.
Key takeaways
- XRP trades at $1.13, sitting below all major daily EMAs in a full bearish stack.
- Daily RSI at 38.28 signals a slow, grinding sell-off rather than outright capitulation.
- The Fear & Greed Index registers 14, deep in Extreme Fear territory, mirroring thin risk appetite.
- A confirmed daily close below $1.11 would open a test of the $1.05 lower Bollinger Band.
- The daily MACD histogram shows a marginal positive divergence — too faint to trade against the prevailing trend.
Daily Chart: The Dominant Bias Is Clear
The daily chart leaves no room for ambiguity regarding the Ripple price trajectory. XRP is trading at $1.13, below the 20-day EMA at $1.19, below the 50-day EMA at $1.27, and dramatically below the 200-day EMA at $1.60. That is a full bearish stack — every major dynamic resistance sits above price, meaning any attempted recovery immediately runs into a wall of sellers. When all three EMAs are descending and price trades below them all, you are not in a correction within a bull trend. You are in a bear trend.
The daily RSI at 38.28 is approaching oversold territory but has not crossed below 30 yet, a subtle but important detail. Markets that are genuinely capitulating tend to push RSI into the 25–30 zone. However, we are not there. What we have instead is a slow, grinding sell-off — the kind that erodes confidence without delivering a sharp flush that clears out weak hands and sets up a proper bounce. That is arguably more dangerous for near-term positioning.
The MACD on the daily chart deserves attention. The line sits at -0.04 with the signal at -0.05, and the histogram has ticked up to +0.01 — a marginal positive divergence. This is not a buy signal; rather, it is the faintest hint that the rate of decline may be slowing. Whether that resolves into consolidation or a dead-cat bounce before the next leg down depends heavily on whether price can hold the current support zone.
Bollinger Bands on the daily chart show price near $1.13, just above the lower band at $1.05. The midline sits at $1.17 and the upper band at $1.30. Price hugging the lower band is not a contrarian signal here — it is confirmation of trend. Moreover, a mean reversion back toward $1.17 is possible, but it would need a catalyst. Without one, the band simply travels lower along with price.
The ATR of $0.06 daily tells you volatility is relatively contained, which means slow-burn downside rather than explosive moves in either direction. Daily pivot data has PP at $1.13, R1 at $1.15, and S1 at $1.11. The proximity of these levels to the current price reflects how tight the range has become. Furthermore, R1 at $1.15 is less than 2% above current price — that is basically nothing for XRP, an asset capable of 5–10% daily swings in healthier conditions. The compression here is a warning: when tight ranges break, they tend to break hard.
Hourly Chart: Confirming the Bearish Regime
The 1H chart is fully aligned with the daily, removing any bullish short-term divergence argument. Price at $1.13 sits below the 20H EMA at $1.14, the 50H EMA at $1.16, and the 200H EMA at $1.17. All three are above price in descending order, an exact replica of the daily stack in miniature. This kind of top-down alignment between timeframes is precisely what sustains trends. There is no internal contradiction that could spark a technical recovery.
The hourly RSI at 33.13 is notably weaker than the daily reading, actually approaching oversold levels. When the shorter timeframe is more oversold than the longer one, it often signals that a tactical bounce could materialize. That said, the direction of the larger trend will reassert itself after any such bounce. Think of it as a pressure release valve, not a reversal. The 1H MACD is flat at -0.01/-0.01 with zero histogram movement — the momentum engine has stalled.
Bollinger Bands on the hourly chart are tight: upper at $1.16, lower at $1.12, mid at $1.14. Price is sitting right in the lower half of this narrow channel. The ATR of $0.01 on the hourly confirms that intraday volatility is essentially dead right now. This is the calm before something moves — likely triggered by a Bitcoin directional decision, given BTC’s current 55.9% dominance grip on the market.
15-Minute Chart: Execution Territory
On the 15-minute chart, XRP is essentially flatlined. The MACD sits at zero, the ATR rounds to zero, and price sits precisely on the EMA20 at $1.13. The RSI at 37.69 mirrors the daily without adding conviction either way. Pivot R1 and PP are both at $1.13 — the market has consolidated into a single price level across all pivot calculations. For execution purposes, a break below $1.12 on this timeframe would be an early warning of renewed selling pressure. A push above $1.14 would be the minimum required to suggest any short-term buying interest is developing.
The Bullish Case: What Would Need to Happen
For XRP bulls to reclaim any structural footing, price needs to get back above $1.17 on a daily closing basis. That is the Bollinger midline and the first meaningful test of the 20-day EMA neighborhood. From there, clearing $1.19 (EMA20) and then $1.27 (EMA50) would be the sequential targets to watch. The slight positive tick in the daily MACD histogram provides the thinnest of technical excuses for a bounce. Furthermore, the RSI approaching oversold on the hourly chart offers a tactical window.
If the broader market stabilizes — particularly if BTC finds footing — XRP could stage a relief rally toward $1.20–$1.25. That would be meaningful for short-term traders but would not change the macro picture. This scenario gets invalidated quickly if price fails to hold above $1.11 (daily S1) and the daily MACD histogram rolls back negative. A confirmed break below $1.11 opens up a test of the lower Bollinger Band at $1.05 with nothing structural in between.
The Bearish Case: Why the Path of Least Resistance Remains Lower
The bearish scenario does not require much imagination — it is the baseline. Every EMA is above price across every timeframe. The regime classification is bearish on the daily, hourly, and 15-minute charts simultaneously. Moreover, market sentiment per the Fear & Greed Index is at its most fearful reading in recent memory. The total crypto market cap dropped 2.4% in the past 24 hours, and volume itself fell over 10%. This is not a panic sell — it is a confidence vacuum. No one is rushing to buy, and no one is rushing to exit. The drift is southward.
A daily close below $1.11 followed by a test of $1.05 is the near-term bearish path. Below $1.05, the next meaningful support is psychological at $1.00. The 200-day EMA at $1.60 now feels like a distant memory. To get back there, XRP would need a structural trend reversal driven by something fundamentally different in market conditions.
This scenario gets challenged if Bitcoin decisively breaks higher and drags altcoins along. Given BTC’s dominance level, any rotation into alts would require BTC to first stabilize or rally. That is a market-wide call, not an XRP-specific one.
Positioning Context: Reading the Room
Anyone currently holding XRP from higher levels is sitting in drawdown, and the technical structure offers no near-term validation for holding with conviction. The timeframes are aligned in the same direction, volatility is compressed, and the macro backdrop — Extreme Fear, falling market cap, declining volume — creates no favorable environment for mean reversion plays without confirmation.
The honest read here is that XRP is in a wait-and-see zone. The MACD whisper of slowing momentum is too faint to trade against the trend. A patient approach makes more sense than forcing a position in the current dead-water range. Waiting for either a confirmed bounce above $1.17 or a breakdown below $1.11 to establish directional risk is the prudent course. Volatility will return; the question is which direction it chooses. Right now, the structure gives bears the benefit of the doubt.
FAQ
What is the current Ripple price outlook?
The Ripple price outlook remains bearish across all major timeframes. With XRP trading at $1.13 and sitting below the 20-day, 50-day, and 200-day EMAs, the technical structure points to continued downward pressure. No reversal signal has been confirmed, and the path of least resistance remains lower.
What are the key support levels for XRP right now?
The immediate support sits at $1.11 (daily S1), followed by the lower Bollinger Band at $1.05. Below that, the psychological $1.00 level becomes the next meaningful floor. A confirmed daily close below $1.11 would validate the bearish continuation toward $1.05.
Can XRP recover above $1.20 in the near term?
A recovery above $1.20 is possible but requires a daily close above $1.17 first — the Bollinger midline and the gateway to the 20-day EMA. The MACD histogram shows a marginal positive divergence, and the hourly RSI is approaching oversold territory. However, any bounce would likely be tactical rather than structural without a broader market catalyst.
Disclaimer: This article is for informational purposes only and does not constitute financial advice, an investment recommendation, or a solicitation to buy or sell any financial instrument or cryptocurrency. The analysis provided is not indicative of future results. Investing in crypto assets and financial markets carries a high risk of capital loss. Always do your own research (DYOR) and consult a qualified financial advisor before making any decision.
Article produced with the assistance of artificial intelligence and reviewed by the editorial team.


 English (US) ·